In my previous posts, I showed that White imprisonment has been growing more in rural areas than urban areas, and that this is tied to the fact that rural places are much more likely to have high poverty rates and low average educational levels. In this post, I follow up by examining the change in the imprisonment rate between the average for 2000-6 and the average for 2007-2013. As the previous posts suggested, the greater rise in imprisonment in rural areas is tied to high poverty and low education. This post shows that the change in imprisonment was more associated with poverty and education for non-urban areas than for urban areas. UPDATE: The working paper based on this and related posts is now available on SocArXiv.
The graphs in this post show changes in the square root of the imprisonment rate. This makes the size of the gap between the largest and smallest changes smaller, but does not change the order of the change sizes between places, nor whether the change was positive or negative.
White
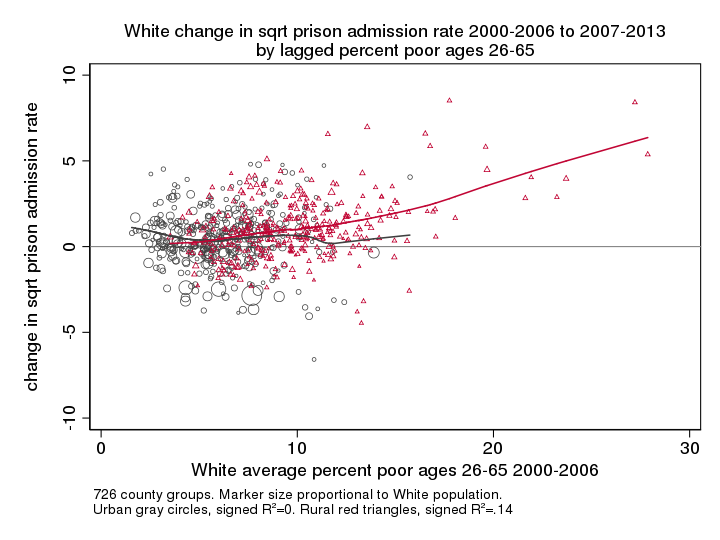
The following graphs plot the change in the square root of the average White imprisonment rate by the percent poor, percent less than high school, and percent college grad,separately for urban and non-urban places. Although the White poverty rate has a strong relation to the White imprisonment rate, changes in the rate seem more tied to educational levels and these ties are much stronger for non-urban counties than urban counties. The first graph shows the plot for poverty. The correlation between White poverty and the change in White imprisonment is 0 for urban areas, but positive for rural areas. The largest upward changes in White imprisonment were in high-poverty rural areas. Note also that the average change is positive for Whites, but there are county groups, especially large urban counties and county groups, where White imprisonment declined.

The next graph plots the change by percent not high school graduates. This graph is quite similar to the poverty graphs but the strength of the relationships are stronger. Places with the lowest rates of White high school drop outs actually had an average decline in White imprisonment, while places where more than 10% of Whites did not finish high school mostly exhibited rising imprisonment.

The graph for college graduation rates is largely the reverse of the high school drop out graph, with rising imprisonment where the college graduation rates are lowest and a stronger relation in rural than urban county groups.
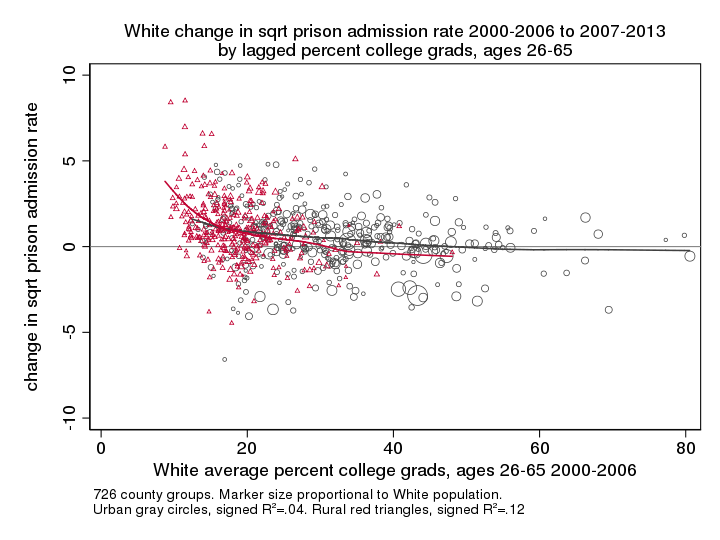
The picture for percent college graduate is largely the reverse of that for high school drop outs, although the relationship is weaker.
Blacks
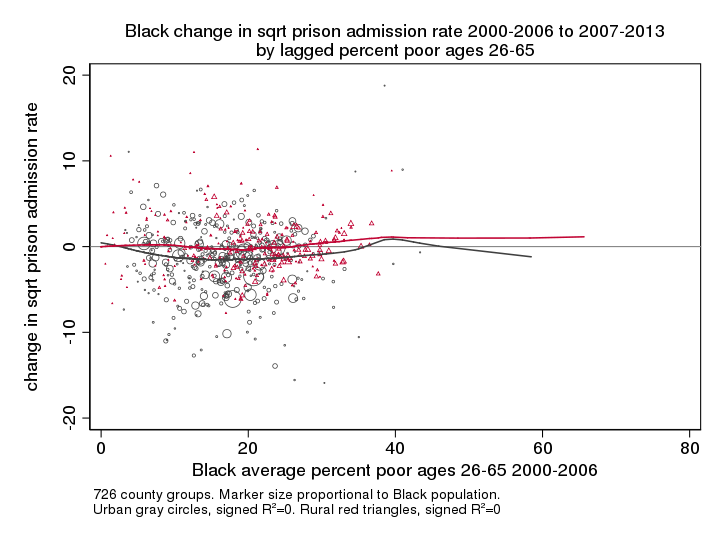
As with the average rates, Black poverty and education levels are less predictive of Black imprisonment rates. The Black prison admission rate declined on average but declined more for urban places than rural places, with the poverty level having essentially zero effect on this.
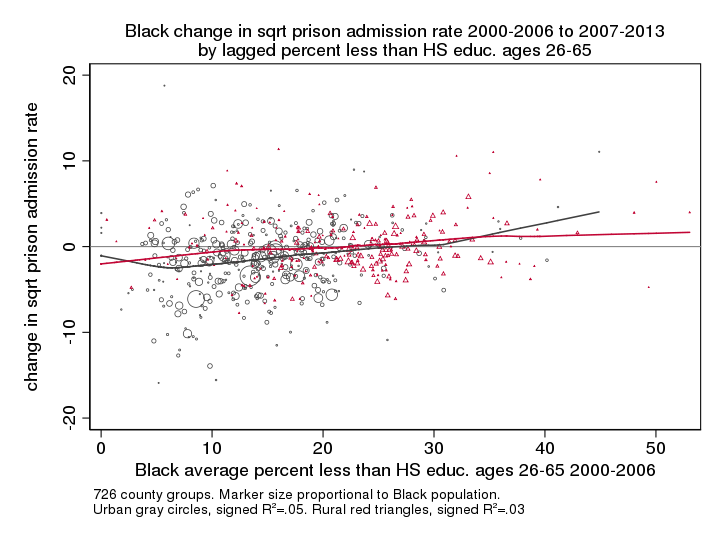
The high school drop out rate for Blacks does have a positive relation with the change in the Black imprisonment rate although this effect is much smaller than that for Whites and seems to be driven by places that have very small Black populations (mere specks in the graph, which plots marker size proportional to Black population).
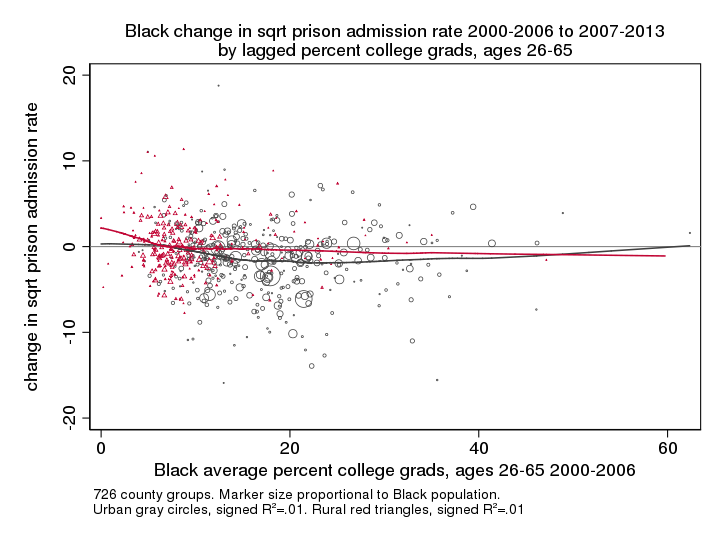
The relation for the percentage college graduate is essentially the same with an even weaker correlation.
Population Proportions
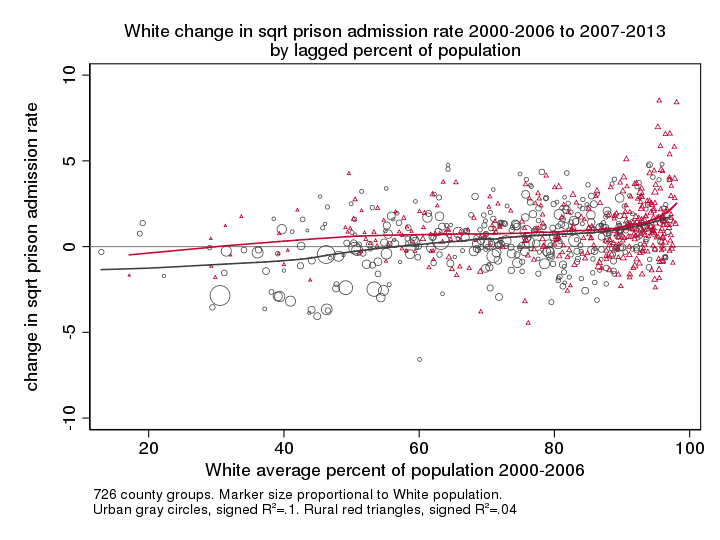
The White population percentage is positively associated with the rate of growth in the White imprisonment rate, especially in urban areas. Many of these overwhelmingly-White areas are the same areas that have high White poverty rates and low White educational levels.
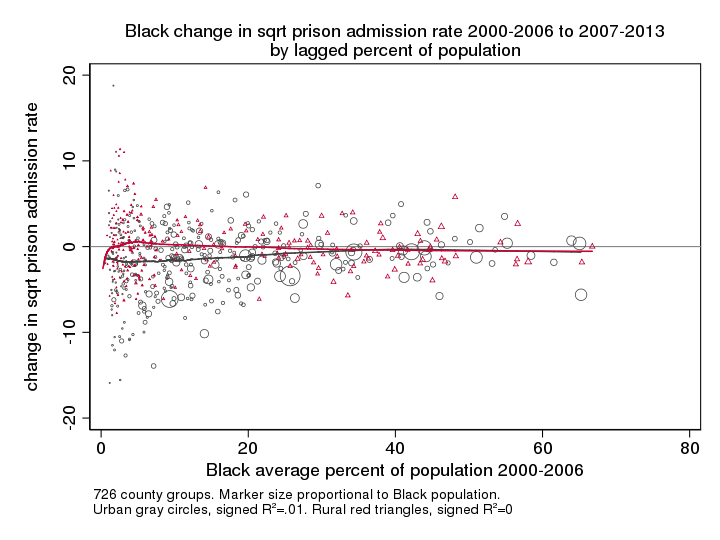
Although the Black population percentage is a strong predictor of the level of Black prison admissions, it is not strongly correlated with the change in the prison admission rate.