
Did Bill Clinton’s policies cause the mass incarceration of Black people? Since I’ve done a lot of analysis of incarceration trends in the 1990s, I thought I’d bring some facts into this discussion. Short version: The steep increase in the mass incarceration of Black people happened before Bill Clinton took office in 1993, under Reagan and Bush I. The Clinton policies that took effect in 1995 encouraged mass incarceration generally but produced larger increases among Whites and other groups than among Blacks. Black prison admissions to state prisons actually fell during the Clinton years. (EDIT: I’ve added a bit more information below to clarify state vs. federal systems and the increase of Blacks in federal prison under Clinton..)
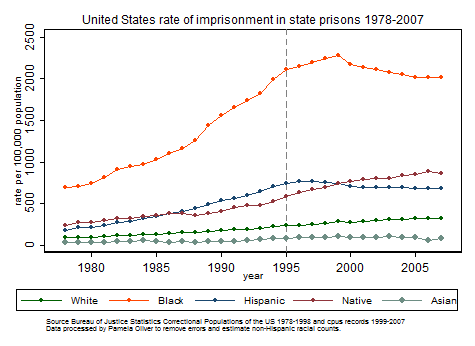
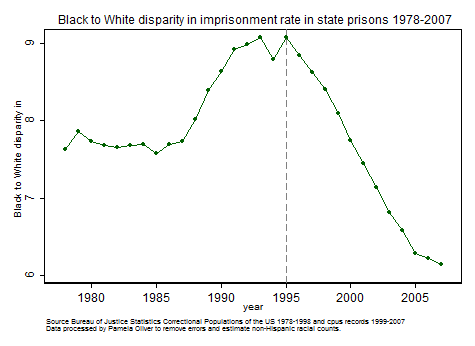
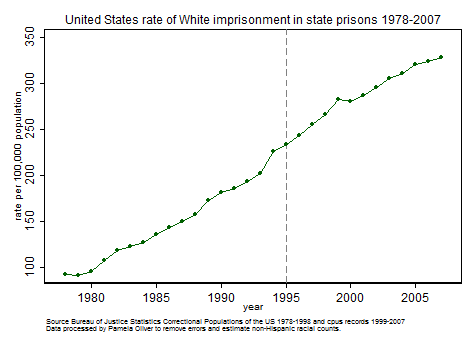
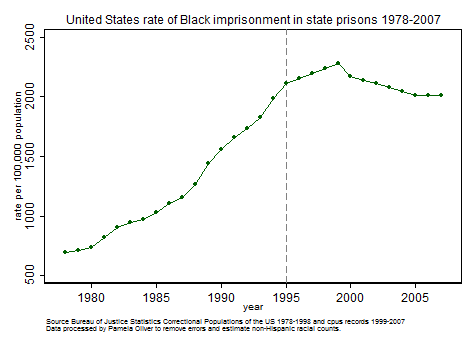
First the graph of imprisonment rates 1978-2007 I calculated from official and unofficial sources.* This is the rate per 100,000 of being in a state prison for Whites, Blacks, Hispanics, Native American Indians, and Asians. This does not include federal prison or jails. The vertical line in the graph is 1995. The big incarceration-supporting legislation of the Clinton administration was the omnibus crime bill of 1994 that, among other things, incentivized prison-building and three strikes laws. The Black rates (the red line at the top) are much higher than other races and clearly rose most steeply prior to 1995. The lowest rates, by the way, are for Asians; Whites are the green line second from the bottom. It you look carefully, you can see that it is White and Native rates than rose most after 1995. As the next graph shows, the Black/White disparity (the ratio of the Black rate to the White rate) in incarceration actually declined after 1995. This is because the White rate kept rising while the Black rate declined. (Graphs for other racial groups are below.)
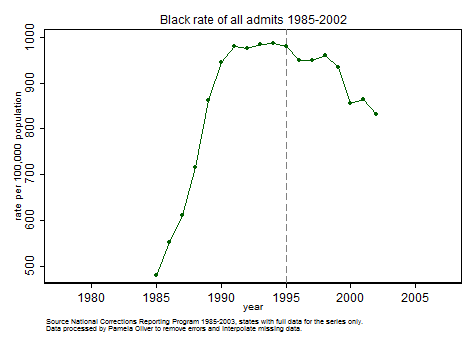
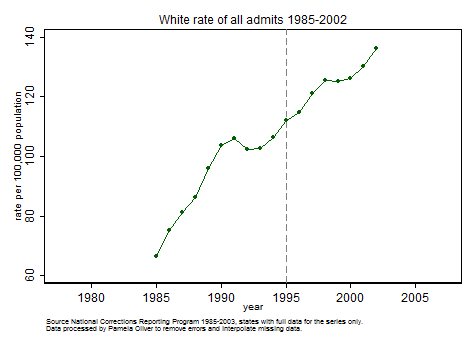
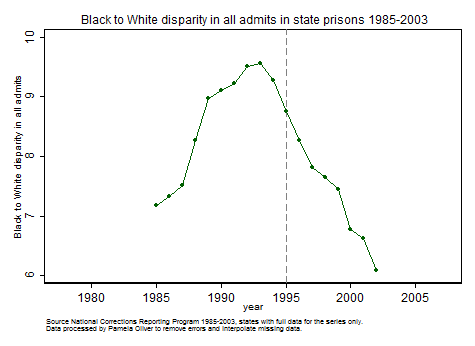
The tale can be even more clearly seen in prison admissions. These come from a different source, the National Corrections Reporting Program. These data are based on voluntary state reports 1985-2002. The chart includes only states for which there is data for the whole period. The Black state prison admission rate actually declined in the Clinton era, while the White rate continued to rise steeply.
The result is a sharp change in the Black/White disparity in prison admissions. Note that the turning point is 1993, the first year Bill Clinton was in office. It seems unlikely that his policies could have had any direct effect on this change, as federal policies can affect state imprisonment only in indirect ways.
Explaining why this happened is more complex and I’ve spent a lot of time looking at the data. The short version is that mass incarceration happened differently in different places at different times. The steep escalation in mass incarceration of Blacks happened in big cities in the late 1980s and early 1990s and was focused on the drug war. The Clinton-era policies expanded mass incarceration more generally with a focus on violent crime, “three strikes” laws, and providing incentives to build more prisons. To be sure, Clinton continued the mass incarceration policies and Black people continued to be locked up for drug charges at rates much higher than Whites, but it cannot be correctly said that Clinton’s policies were the initial or main cause of Black incarceration, even as it can correctly be said that his policies continued mass incarceration and spread it to other groups.The rise in mass incarceration in the Clinton era happened outside the big cities and had greater impact in smaller cities and rural areas, where White people live. The rise in incarceration for Native people also shows up in the CPUS data, but I have not yet been able to study where and why that happened.
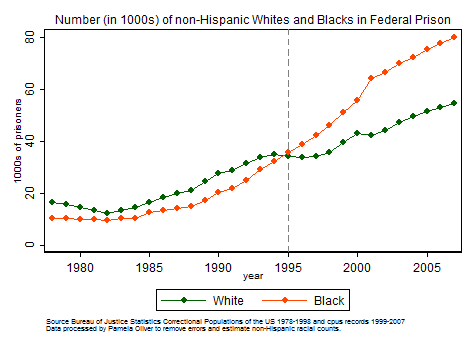
EDIT: After posting, I realized that I was showing rates, not raw numbers, which could be affected by shifts in population demographics, and showing only the federal system, where Clinton’s drug policies may have had more effect. So this addition clarifies both points.
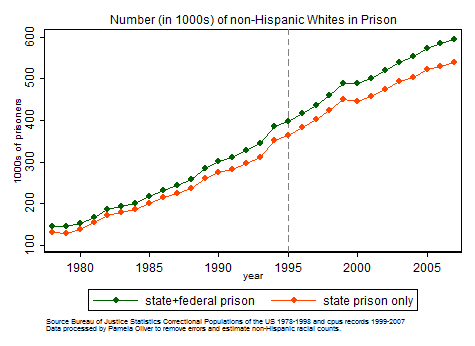
First numbers (not rates) of Whites entering prison: the top green line is the total and the bottom red line is state prisons only; my graphs above show only state prisons.
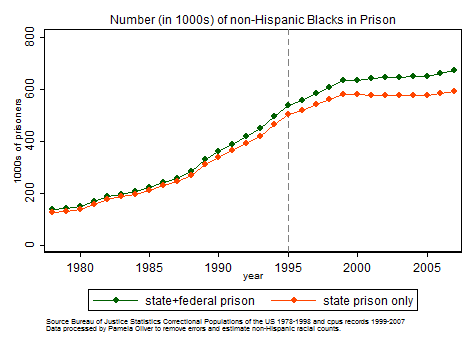
Blacks next. The leveling off is happening more in state prisons, and the share accounted for by federal is going up. The gap looks wider after 2000.
Racial disparity index by system. State prisons and thus the total imprisonment show a declining disparity after 1995. However the disparity in the federal system keeps rising after 1995. So it would be fair to criticize Bill Clinton for continuing federal drug policy.
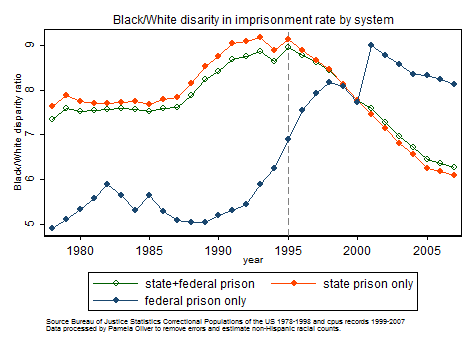
The number of Black federal prisoners increased faster than White, so Bill Clinton can be blamed for that proportion of the issue.
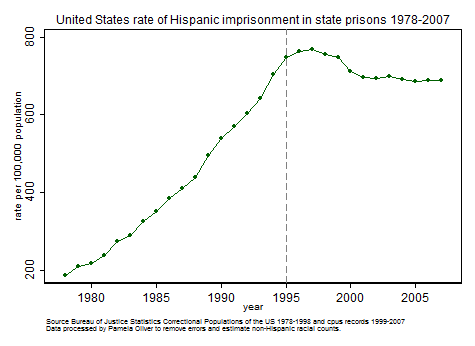
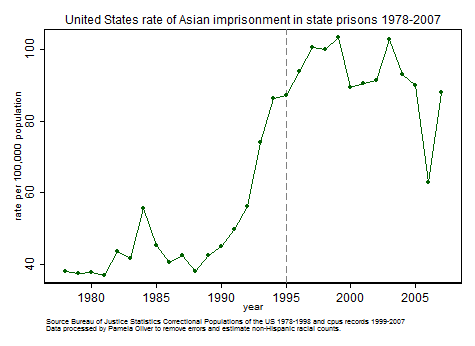
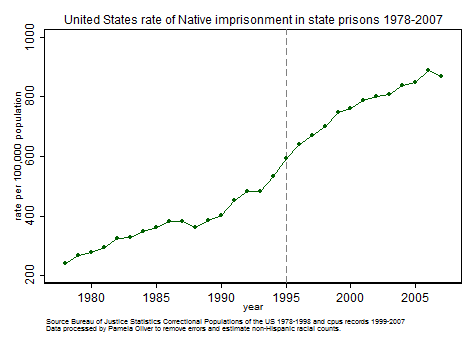
Below I provide close-up graphs of the CPUS data for other racial groups. You’ll see in the CPUS data that White and Native rates rose steadily between 1978 and 2007 while Black, Hispanic and Asian rates leveled off after 1995.
CPUS imprisonment rates
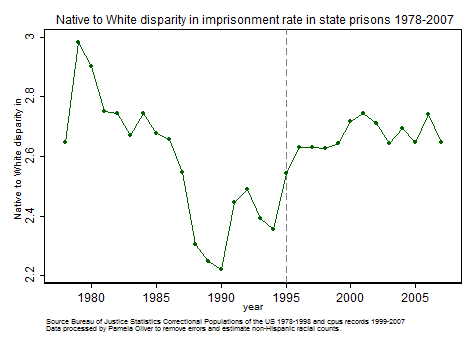
CPUS minority/white imprisonment disparity ratios
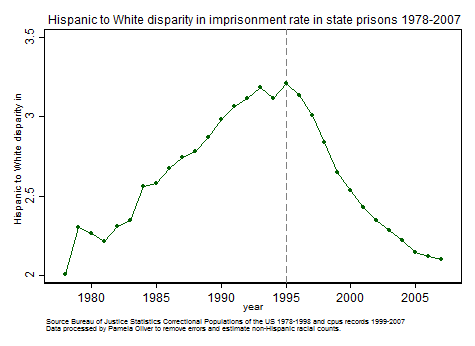
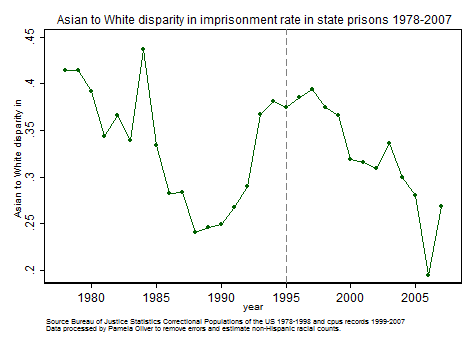
Asian imprisonment rates are lower than White, so the disparity ratios in the Asian graph are decimal numbers less than 1, ranging from .2 to .45, i.e. that White rates are 2 to 5 times higher than Asian rates.
* The official CPUS reports ended in 1998. I received from the Bureau of Justice Statistics an unofficial spreadsheet of data submissions for 1999-2007. These unofficial data had not been cleaned, were stamped “UNOFFICIAL” in big red letters on every page, and clearly contained errors. I cleaned the data by constructing data series by race for each state, as the number in prison cannot change markedly from year to year. For most years and states it was possible to identify and correct errors by checking totals against each other and those for adjacent years; in some cases I interpolated a cell from adjacent years when numbers in a particular cell were obviously wrong. Data for 2006 were so bad that they had to be discarded entirely; all 2006 numbers are interpolations of 2005 and 2007. I also dealt with inconsistent reporting of Hispanics by carefully examining the counts in the “race unknown” category relative to Hispanics and totals to determine how Hispanics had been categorized by race in different states in different years and made appropriate adjustments. I feel quite confident that the graphs I have produced from these data faithfully represent the patterns in the data and do not introduce biases in telling the story. An updated version of these data through 2013 has recently been released, but I have not yet had time to process the updated data as they, too, embody some errors and inconsistent treatment of Hispanics across time and place.
Figures form the National Corrections Reporting Program come from the old releases of these data I obtained in 2003 and were also cleaned to remove obvious errors. When possible, data for missing years from a state were interpolated from adjacent years if there were data both before and after the year missing data. The graphs for national totals include only those 25 states with consistent data for 1985-2002 so that national totals will not be affected by missing data.
Clinton was the President. That is a federal position. Why did I have to read half way down before encountering, “federally the black incarceration rate rose faster for the black population, than for the white.” We are supposed to be examine federal policy. What nonsense is this?
Thanks for your comment. The answer to your question is that Bill Clinton’s Omnibus Crime bill (a) incentivized prison building by states and directly added to mass incarceration and (b) directly added to mass imprisonment by incentivizing states to give more prison sentences for violent offenses and for non-violent offenses via “three strikes” laws. These federal government influences state policies indirectly through giving them money for things. The crime bill gave states money if they increased imprisonment. My research has focused on state imprisonment rates, so that is what I focused on. Then it occurred to me that I should check the federal rates and, when I learned that Black imprisonment in federal prisons had gone up, I reported that. Federal prisons are, however, a very small part of the whole system of mass incarceration. People went to federal prison mostly for drug crimes, and the Draconian drug laws that were sending people to prison did not change substantially at that time. Drug offenses generally can be charged either under state laws or under federal laws. I have detailed offense information for state prisons but not federal prison, so I don’t know what offenses people were going to federal prison for, nor why they were going there. But I’m not sure Clinton’s policies affected that in the same way as they definitely affected state imprisonment. What I had found in my data, and the reason I wrote the post, is that there is a clear pattern in the data that WHITE state imprisonment goes up after the Clinton policies were enacted.
This actually answered my downside, thanks!