There were many US Black protests about policing before the Black Lives Matter protests after 2014. Drawing on archives of 950 articles including 310 from three mainstream newswire services and 640 from 37 Black newspapers as sources of information, we identified about 1,059 Black-relevant protest events about policing in the United States between 1994 and 2010. These 1,059 events were about 279 different specific issues in more than one hundred cities, including 103 separate cases of police killings (37% of all specific issues) and another 64 cases of non-fatal claims of police brutality (23% of all specific issues) in more than 70 different cities. Other kinds of policing issues were non-fatal instances of police brutality, protests about police brutality in general not tied to a specific case, other complaints about discriminatory policing, and miscellaneous policing issues. There were, on average, many more protest events about fatal policing issues than nonfatal policing issues. The number of protests about an issue increases the rate of news coverage of events about that issue.
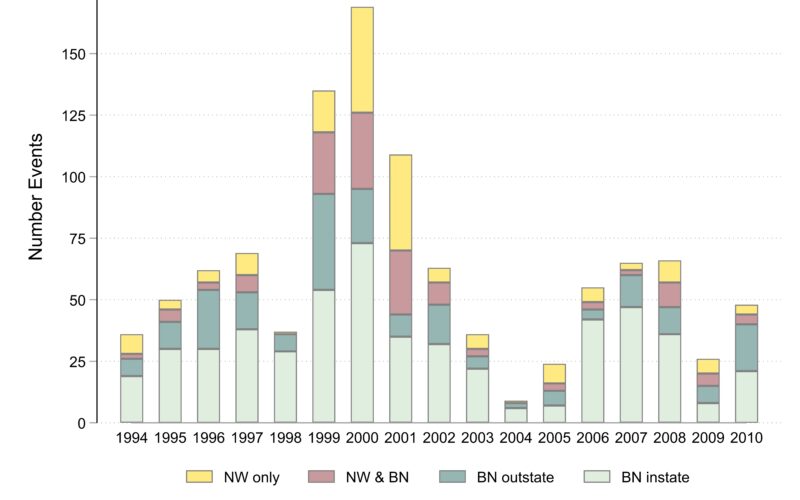
All the graphs show a general rise in protests in the 1990s with a peak 1999 to 2001, then a drop off after the terror attacks of September 11, 2001, a low point in 2004, and then a rise in activity toward the end of the 2000s.
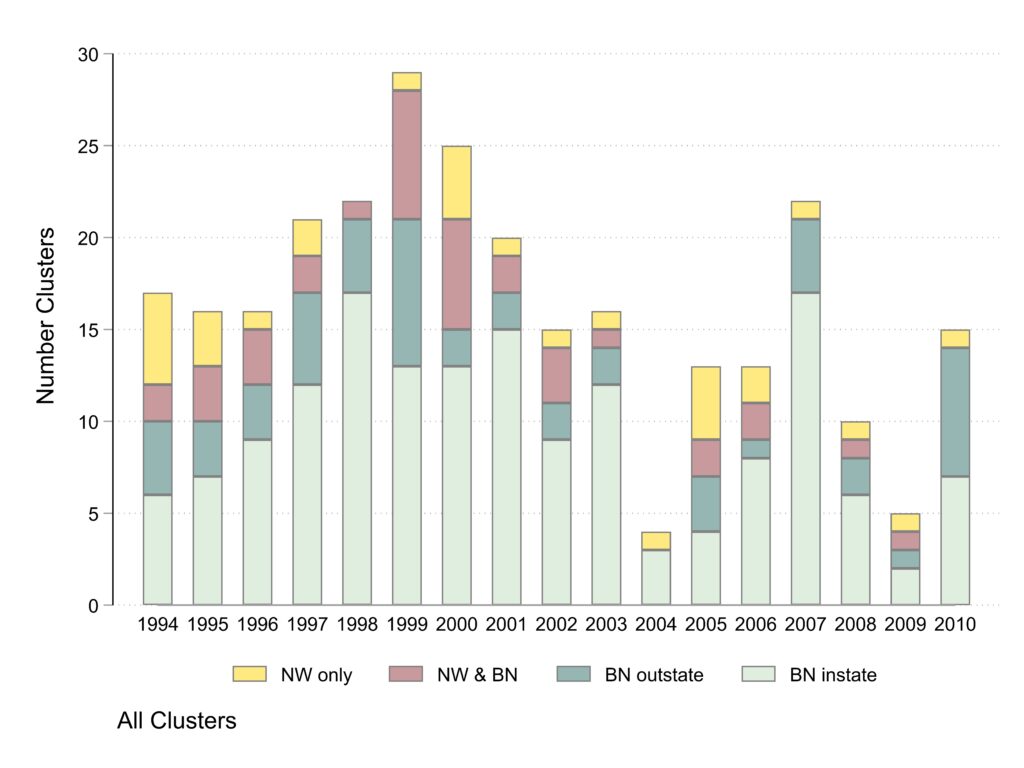
Our concept of “specific issue cluster” is all the events that were about the same specific thing such as the New York police killing of Amadou Diallo or the annual October 22 National Day of Protest Against Police Brutality. Most specific issue clusters include only one or two events, but large ones such as the Diallo or National Day protests include large numbers of events.
For these plots, events are distinguished by the types of news sources that covered them. (1) Black newspapers covering events in the state where the event occurred (BN instate), (2) Some Black newspaper coverage from sources outside the state with or without in-state coverage as well but no newswire coverage (BN outstate), (3) Both Black newspaper (instate or outstate) and mainstream newswire coverage (NW & BN), (4) Newswire coverage only (NW only).
The first table shows the proportion of fatal issues by coverage type for articles, events, estimated minimum number of participants, and clusters. Black newspaper articles are subdivided by those that discuss at least one event occurring in the state where the newspaper is published and those that are only discussing events in other places. No article can be both Newswire and Black news but events and clusters that are covered by more than one article may be covered by both Black newspapers and newswires. The table shows that the proportion of newswire articles and of events and participants in events covered by newswires that involved fatal incidents is much higher than for events covered only in Black newspapers. The cluster column reveals that specific issue clusters covered by both newswire and Black newspapers are especially likely to involve fatalities and for issue clusters covered by only one source type, newswires cover more issues involving fatalities than Black newspapers and non-local (outstate) coverage involves more fatalities than local (state) Black newspaper coverage. The higher fraction of participants for BN state than BN outstate is because there is a great deal of outstate Black newspaper coverage of events about the annual October 22 day against police violence. In 1999-2000, in the wake of the killing of Amadou Diallo in New York and Tyisha Miller in Riverside, California, and other cases, Black activists held many events and sought to build momentum for a movement against police brutality in general. These “brutality in general” events got much more coverage in Black newspapers than in newswires.
Proportion About Policing Issues Involving Fatalities
| Articles | Events | Participants | Clusters | |
| BN state | 59 | 53 | 48 | 27 |
| BN outstate | 74 | 56 | 27 | 38 |
| NW+BN | . | 86 | 84 | 72 |
| Newswire | 88 | 82 | 77 | 47 |
| Total | 73 | 69 | 59 | 46 |
Specific Issue Clusters
The first time plot shows is the number of specific issue clusters, the things people were protesting about, by year. Most specific issues garnered only one or two protests, but there were a lot of protests about a few issues. The event counts will be the next graph. Classification of coverage type is across all the events in the cluster. So, for example, if some events in a cluster got local Black newspaper coverage only (the most common type of event coverage) while one event also got newswire coverage, the cluster is categorized is getting both newswire and Black newspaper coverage. What I see in the graph: (1) The number of specific issue clusters covered only in Black instate sources is relatively consistent over the years although there are low points in 2004 and 2009 and a high point in 2007. (2) The number of issues covered by non-local Black newspapers or both Black newspapers and newswires seems substantially lower after 2000. (3) The distribution of issues across years is generally more even than for events or participants in the graphs below.
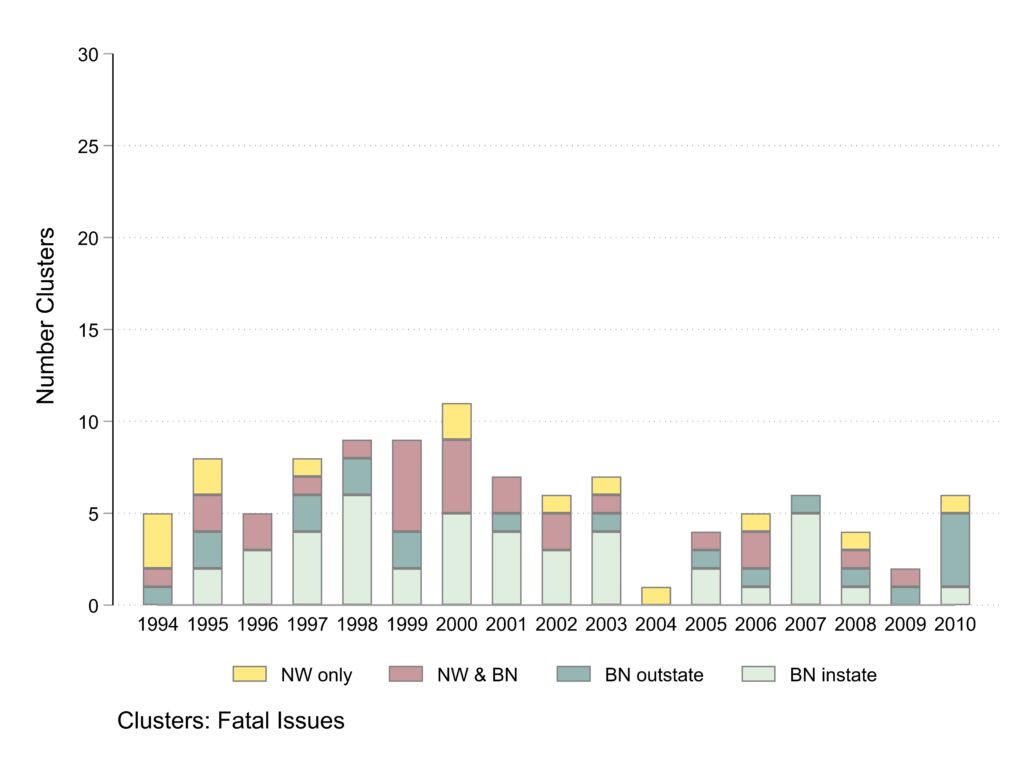
Clusters about fatal issues
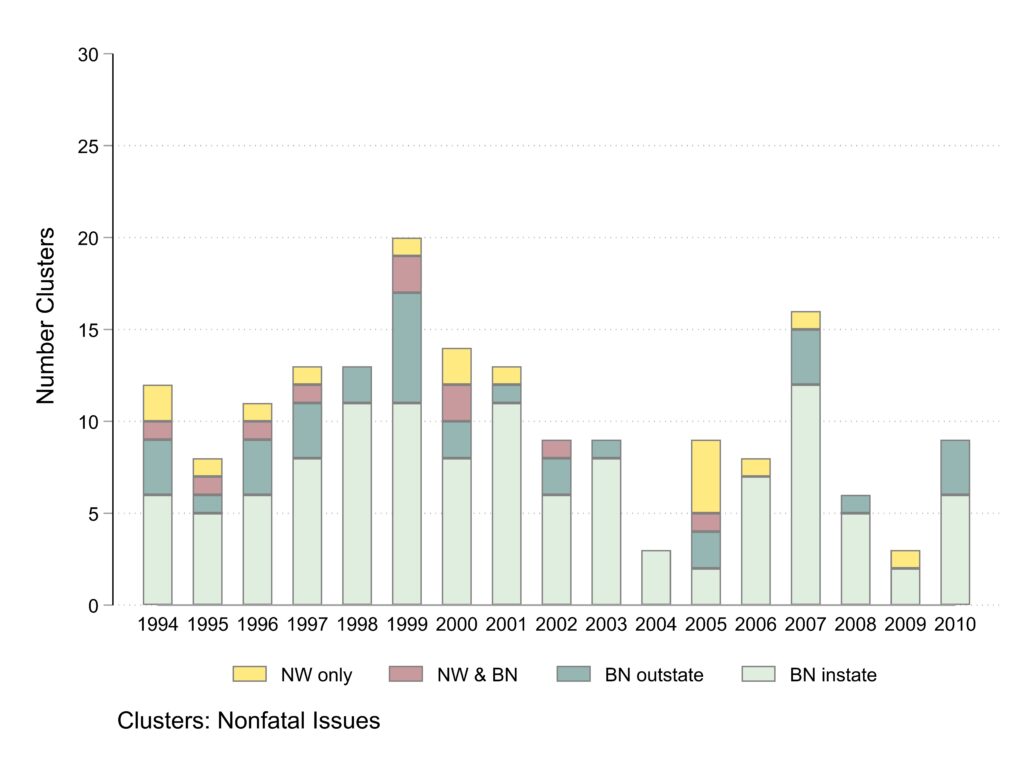
This graph and the next separate clusters by whether they involve fatalities or not. The scale is kept constant between the two graphs to help convey visually the fact that the majority of clusters are about non-fatal issues and those were primarily covered by Black newspapers reporting on events in the state where the newspaper is published.
Clusters about nonfatal issues
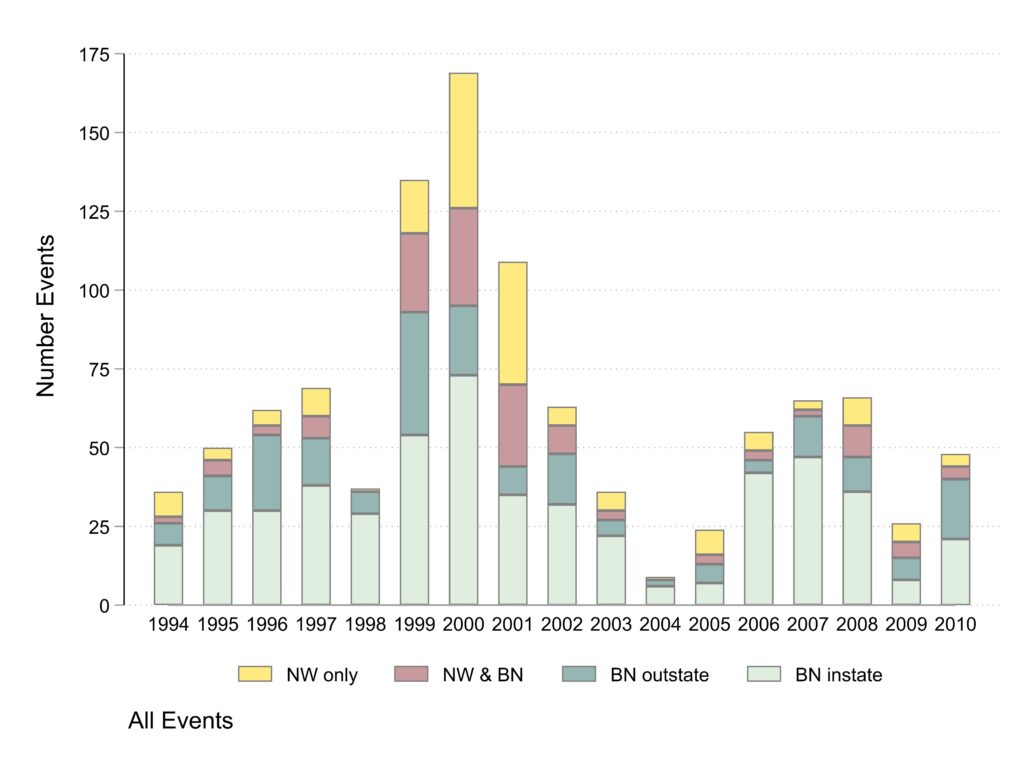
Events
The next graph is counts of events by coverage type. What I see i the graph: (1) Much more year-to-year variability than for clusters, which is due to the years in which the big clusters appear, especially 1999-2000 in New York around the killing of Amadou Diallo and 2001 in Cincinnati around the killing of Timothy Thomas. (2) Again the umber of events covered only by local Black newspapers varies less from year to year than the events covered by newswires or non-local Black newspapers. (3) There is a peak in events 1999-2001.
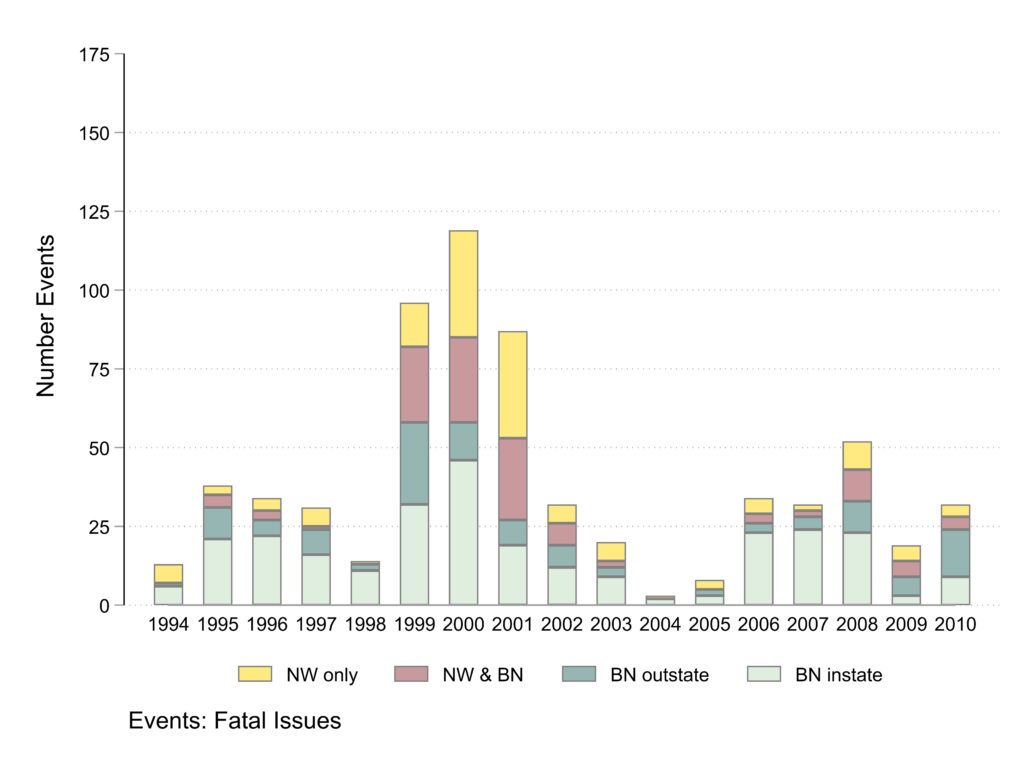
Events about fatal issues
Unlike clusters, a majority of events are about fatalities and the large clusters involving dozens of events produce large peaks in protests especially in 1999 to 2001.
Events about nonfatal policing issues
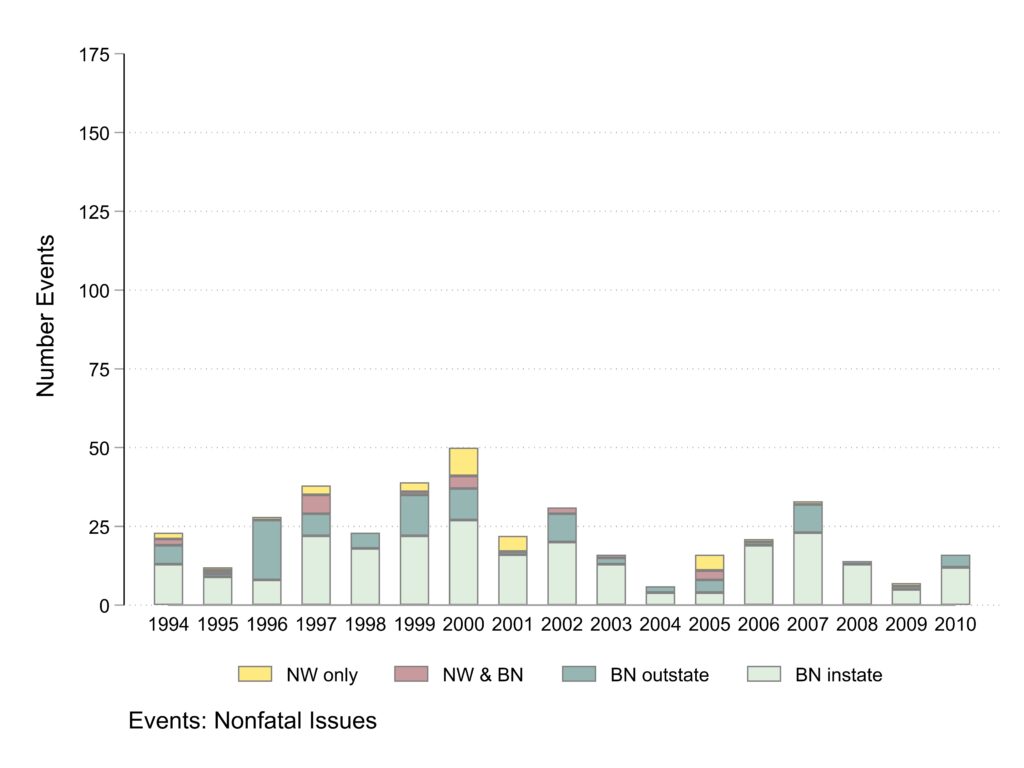
Number of Participants
In our project, we ask coders to provide estimates of the minimum and maximum number of participants in each event from all of the available contextual information in news articles. Here I present the graphs using the minimum participation estimates again by the type of news coverage the event got. The main thing I see in the graph is that events covered by both newswires and Black newspapers or by non-local Black newspapers account for most of the participants. And participation varies greatly with a few peak years 1997, 1999, 2000, and 2006 being much higher than other years.
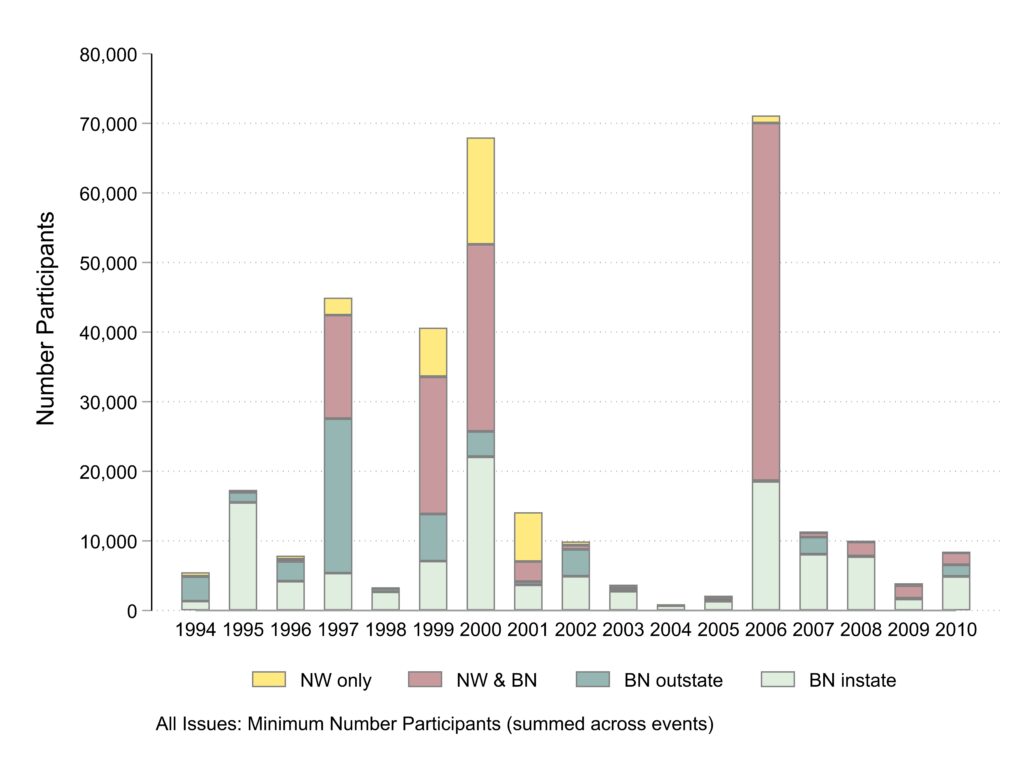
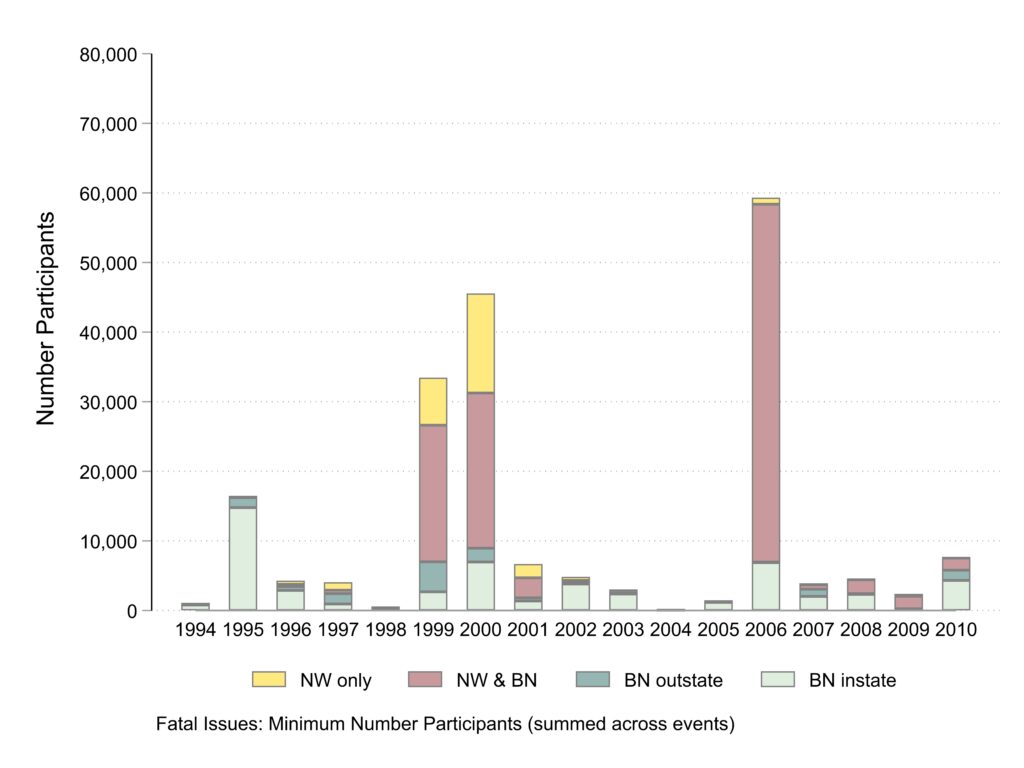
Participants in events about fatal issues
The graph of participants about fatal issues is very similar to the total graph as the fatal issues draw more participants.
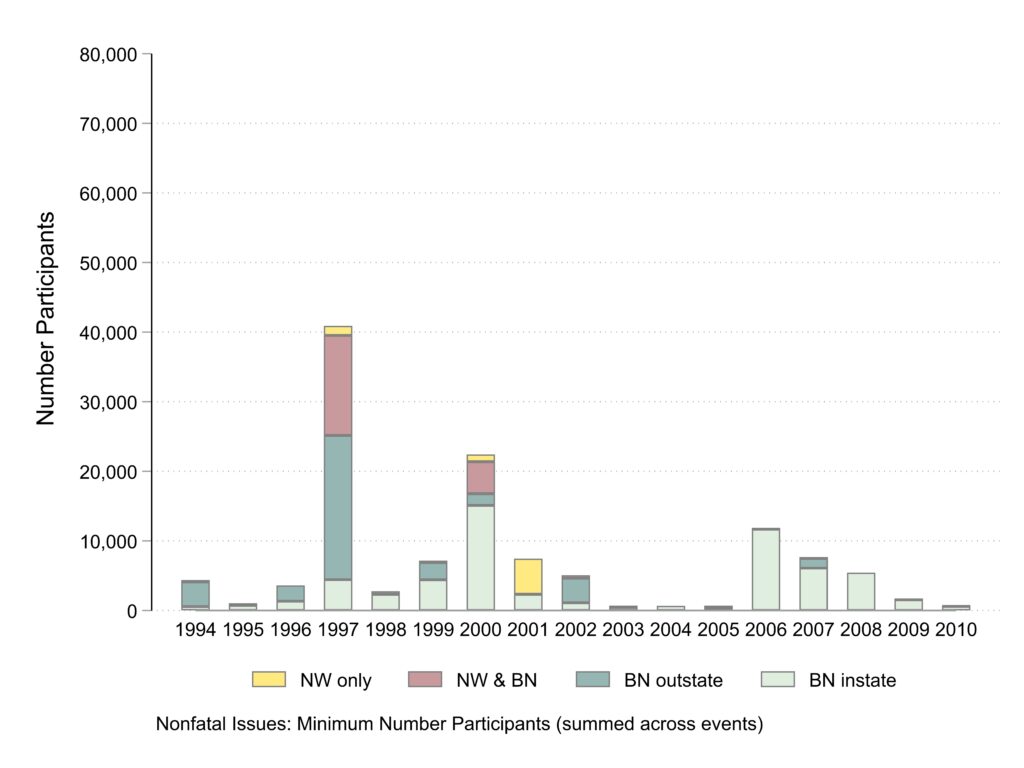
Participants in events about nonfatal incidents
Similar to prior graphs, participants in protests about non-fatal incidents are mostly covered in local Black newspapers. The main exception is 1997 which included the protests about New York police officers torturing Abner Louima in a police station bathroom often covered by both newswires and Black newspapers and the non-local coverage of protests about police brutality in general.
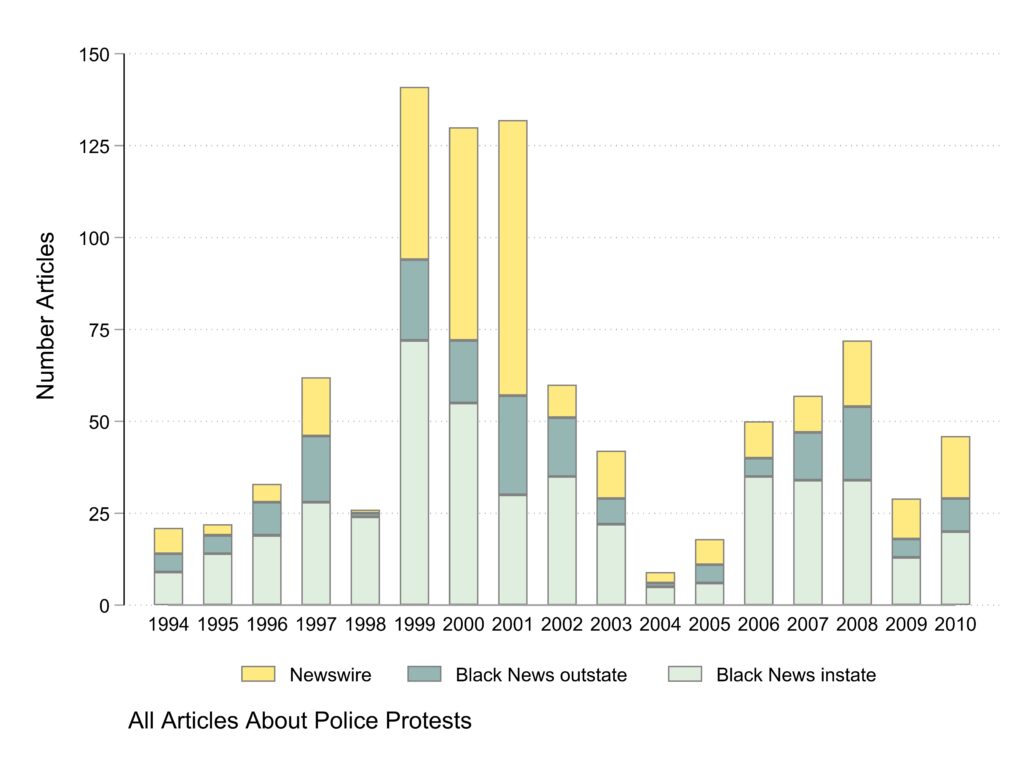
Articles
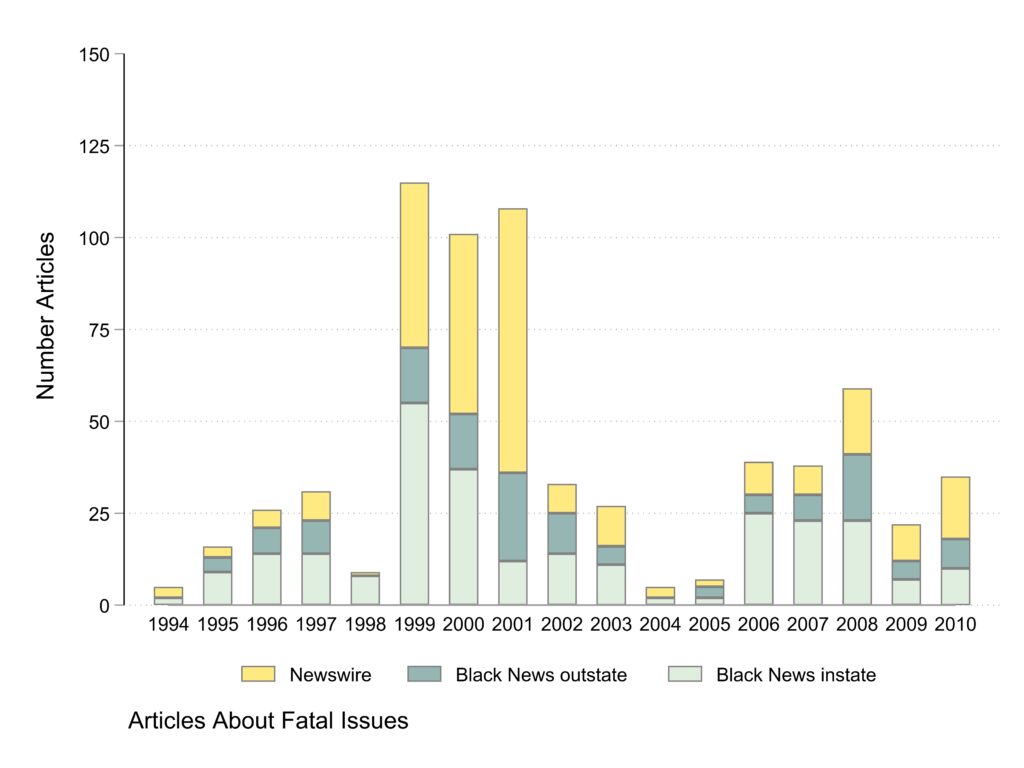
These plots show the number of articles by news source type. Any given article is either newswire or Black newspaper so the “NW & BN” category does not appear in these graphs. The main pattern is that newswire articles about police protests are especially common in 1999 to 2001 and all article types exhibit the 2004 drop.
Articles about fatal issues
The plot of articles about fatal issues looks very similar to the total plot because fatal issues both have more events and get more coverage.
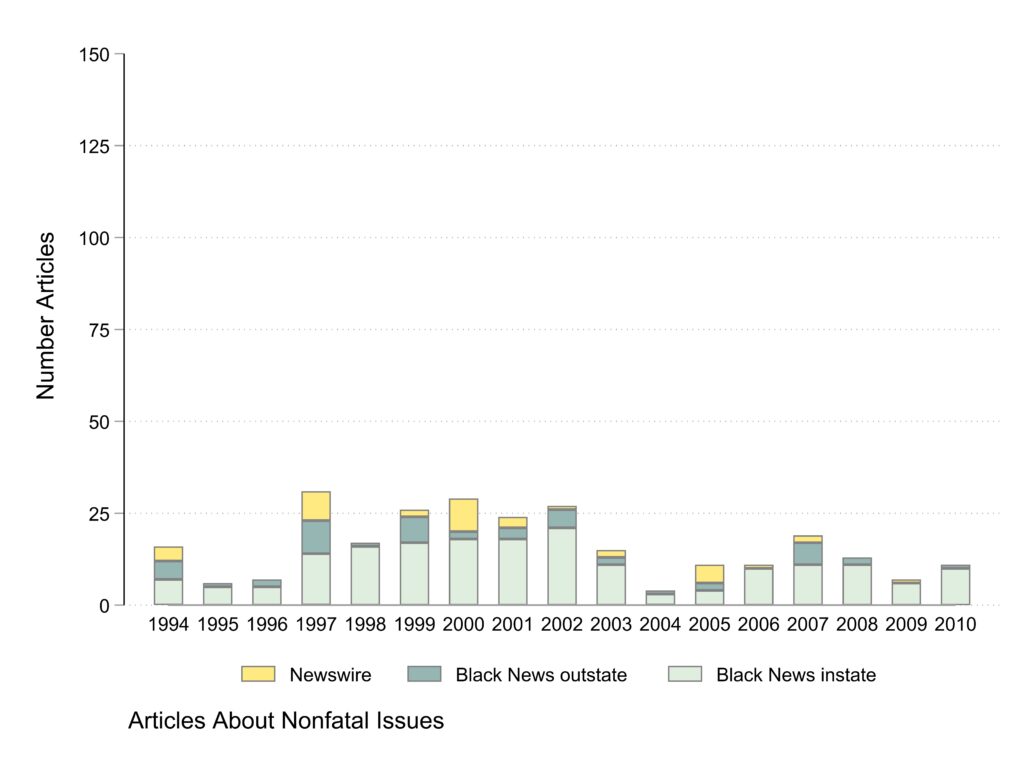
Articles about nonfatal issues
The majority of articles about nonfatal issues appear in Black newspapers and there are fewer articles about nonfatal issues.
Tables
The tables below include the numbers underlying the graphs above. They are included primarily for accessibility for people using screen readers.
The first table is clusters.
Clusters
| Total | Fatal | Nonfatal | ||||||||||
| BN instate | BN outstate | NW & BN | NW only | BN instate | BN outstate | NW & BN | NW only | BN instate | BN outstate | NW & BN | NW only | |
| 1994 | 6 | 4 | 2 | 5 | 0 | 1 | 1 | 3 | 6 | 3 | 1 | 2 |
| 1995 | 7 | 3 | 3 | 3 | 2 | 2 | 2 | 2 | 5 | 1 | 1 | 1 |
| 1996 | 9 | 3 | 3 | 1 | 3 | 0 | 2 | 0 | 6 | 3 | 1 | 1 |
| 1997 | 12 | 5 | 2 | 2 | 4 | 2 | 1 | 1 | 8 | 3 | 1 | 1 |
| 1998 | 17 | 4 | 1 | 0 | 6 | 2 | 1 | 0 | 11 | 2 | 0 | 0 |
| 1999 | 13 | 8 | 7 | 1 | 2 | 2 | 5 | 0 | 11 | 6 | 2 | 1 |
| 2000 | 13 | 2 | 6 | 4 | 5 | 0 | 4 | 2 | 8 | 2 | 2 | 2 |
| 2001 | 15 | 2 | 2 | 1 | 4 | 1 | 2 | 0 | 11 | 1 | 0 | 1 |
| 2002 | 9 | 2 | 3 | 1 | 3 | 0 | 2 | 1 | 6 | 2 | 1 | 0 |
| 2003 | 12 | 2 | 1 | 1 | 4 | 1 | 1 | 1 | 8 | 1 | 0 | 0 |
| 2004 | 3 | 0 | 0 | 1 | 0 | 0 | 0 | 1 | 3 | 0 | 0 | 0 |
| 2005 | 4 | 3 | 2 | 4 | 2 | 1 | 1 | 0 | 2 | 2 | 1 | 4 |
| 2006 | 8 | 1 | 2 | 2 | 1 | 1 | 2 | 1 | 7 | 0 | 0 | 1 |
| 2007 | 17 | 4 | 0 | 1 | 5 | 1 | 0 | 0 | 12 | 3 | 0 | 1 |
| 2008 | 6 | 2 | 1 | 1 | 1 | 1 | 1 | 1 | 5 | 1 | 0 | 0 |
| 2009 | 2 | 1 | 1 | 1 | 0 | 1 | 1 | 0 | 2 | 0 | 0 | 1 |
| 2010 | 7 | 7 | 0 | 1 | 1 | 4 | 0 | 1 | 6 | 3 | 0 | 0 |
| Total | 160 | 53 | 36 | 30 | 43 | 20 | 26 | 14 | 117 | 33 | 10 | 16 |
The second table is events
Events
| Total | Fatal | Nonfatal | ||||||||||
| BN instate | BN outstate | NW & BN | NW only | BN instate | BN outstate | NW & BN | NW only | BN instate | BN outstate | NW & BN | NW only | |
| 1994 | 19 | 7 | 2 | 8 | 6 | 1 | 0 | 6 | 13 | 6 | 2 | 2 |
| 1995 | 30 | 11 | 5 | 4 | 21 | 10 | 4 | 3 | 9 | 1 | 1 | 1 |
| 1996 | 30 | 24 | 3 | 5 | 22 | 5 | 3 | 4 | 8 | 19 | 0 | 1 |
| 1997 | 38 | 15 | 7 | 9 | 16 | 8 | 1 | 6 | 22 | 7 | 6 | 3 |
| 1998 | 29 | 7 | 0 | 1 | 11 | 2 | 0 | 1 | 18 | 5 | 0 | 0 |
| 1999 | 54 | 39 | 25 | 17 | 32 | 26 | 24 | 14 | 22 | 13 | 1 | 3 |
| 2000 | 73 | 22 | 31 | 43 | 46 | 12 | 27 | 34 | 27 | 10 | 4 | 9 |
| 2001 | 35 | 9 | 26 | 39 | 19 | 8 | 26 | 34 | 16 | 1 | 0 | 5 |
| 2002 | 32 | 16 | 9 | 6 | 12 | 7 | 7 | 6 | 20 | 9 | 2 | 0 |
| 2003 | 22 | 5 | 3 | 6 | 9 | 3 | 2 | 6 | 13 | 2 | 1 | 0 |
| 2004 | 6 | 2 | 0 | 1 | 2 | 0 | 0 | 1 | 4 | 2 | 0 | 0 |
| 2005 | 7 | 6 | 3 | 8 | 3 | 2 | 0 | 3 | 4 | 4 | 3 | 5 |
| 2006 | 42 | 4 | 3 | 6 | 23 | 3 | 3 | 5 | 19 | 1 | 0 | 1 |
| 2007 | 47 | 13 | 2 | 3 | 24 | 4 | 2 | 2 | 23 | 9 | 0 | 1 |
| 2008 | 36 | 11 | 10 | 9 | 23 | 10 | 10 | 9 | 13 | 1 | 0 | 0 |
| 2009 | 8 | 7 | 5 | 6 | 3 | 6 | 5 | 5 | 5 | 1 | 0 | 1 |
| 2010 | 21 | 19 | 4 | 4 | 9 | 15 | 4 | 4 | 12 | 4 | 0 | 0 |
| Total | 529 | 217 | 138 | 175 | 281 | 122 | 118 | 143 | 248 | 95 | 20 | 32 |
The third table is participants
Total Participants, minimum
| Total | Fatal | Nonfatal | ||||||||||
| BN instate | BN outstate | NW & BN | NW only | BN instate | BN outstate | NW & BN | NW only | BN instate | BN outstate | NW & BN | NW only | |
| 1994 | 1,339 | 3,545 | 51 | 544 | 785 | 20 | 294 | 554 | 3,525 | 51 | 250 | |
| 1995 | 15,523 | 1,455 | 162 | 165 | 14,781 | 1,445 | 62 | 140 | 742 | 10 | 100 | 25 |
| 1996 | 4,210 | 2,842 | 320 | 511 | 2,885 | 561 | 320 | 511 | 1,325 | 2,281 | 0 | |
| 1997 | 5,361 | 22,205 | 14,880 | 2,510 | 935 | 1,480 | 500 | 1,145 | 4,426 | 20,725 | 14,380 | 1,365 |
| 1998 | 2,684 | 454 | 80 | 366 | 4 | 80 | 2,318 | 450 | ||||
| 1999 | 7,089 | 6,781 | 19,724 | 7,039 | 2,666 | 4,327 | 19,624 | 6,837 | 4,423 | 2,454 | 100 | 202 |
| 2000 | 22,090 | 3,639 | 26,889 | 15,363 | 6,979 | 1,976 | 22,289 | 14,323 | 15,111 | 1,663 | 4,600 | 1,040 |
| 2001 | 3,694 | 457 | 2,890 | 7,088 | 1,365 | 437 | 2,890 | 1,985 | 2,329 | 20 | 5,103 | |
| 2002 | 4,913 | 3,860 | 603 | 531 | 3,800 | 334 | 173 | 531 | 1,113 | 3,526 | 430 | |
| 2003 | 2,783 | 256 | 401 | 273 | 2,356 | 201 | 201 | 273 | 427 | 55 | 200 | |
| 2004 | 705 | 0 | 200 | 35 | 200 | 670 | 0 | |||||
| 2005 | 1,326 | 243 | 165 | 401 | 1,150 | 101 | 215 | 176 | 142 | 165 | 186 | |
| 2006 | 18,535 | 112 | 51,400 | 1,075 | 6,865 | 102 | 51,400 | 975 | 11,670 | 10 | 100 | |
| 2007 | 8,092 | 2,439 | 640 | 35 | 2,009 | 1,050 | 640 | 30 | 6,083 | 1,389 | 5 | |
| 2008 | 7,747 | 86 | 2,000 | 150 | 2,327 | 86 | 2,000 | 150 | 5,420 | 0 | ||
| 2009 | 1,648 | 125 | 1,800 | 346 | 121 | 125 | 1,800 | 341 | 1,527 | 0 | 5 | |
| 2010 | 4,900 | 1,662 | 1,710 | 122 | 4,310 | 1,495 | 1,710 | 122 | 590 | 167 | ||
| Total | 112,639 | 50,161 | 123,635 | 36,433 | 53,735 | 13,744 | 103,609 | 28,152 | 58,904 | 36,417 | 20,026 | 8,281 |
The last table is articles
Participants (minimum)
| Total | Fatal | Nonfatal | |||||||
| NW | BN outstate | BN instate | NW | BN outstate | BN instate | NW | BN outstate | BN instate | |
| 1994 | 7 | 5 | 9 | 3 | 0 | 2 | 4 | 5 | 7 |
| 1995 | 3 | 5 | 14 | 3 | 4 | 9 | 0 | 1 | 5 |
| 1996 | 5 | 9 | 19 | 5 | 7 | 14 | 0 | 2 | 5 |
| 1997 | 16 | 18 | 28 | 8 | 9 | 14 | 8 | 9 | 14 |
| 1998 | 1 | 1 | 24 | 1 | 0 | 8 | 0 | 1 | 16 |
| 1999 | 47 | 22 | 72 | 45 | 15 | 55 | 2 | 7 | 17 |
| 2000 | 58 | 17 | 55 | 49 | 15 | 37 | 9 | 2 | 18 |
| 2001 | 75 | 27 | 30 | 72 | 24 | 12 | 3 | 3 | 18 |
| 2002 | 9 | 16 | 35 | 8 | 11 | 14 | 1 | 5 | 21 |
| 2003 | 13 | 7 | 22 | 11 | 5 | 11 | 2 | 2 | 11 |
| 2004 | 3 | 1 | 5 | 3 | 0 | 2 | 0 | 1 | 3 |
| 2005 | 7 | 5 | 6 | 2 | 3 | 2 | 5 | 2 | 4 |
| 2006 | 10 | 5 | 35 | 9 | 5 | 25 | 1 | 0 | 10 |
| 2007 | 10 | 13 | 34 | 8 | 7 | 23 | 2 | 6 | 11 |
| 2008 | 18 | 20 | 34 | 18 | 18 | 23 | 0 | 2 | 11 |
| 2009 | 11 | 5 | 13 | 10 | 5 | 7 | 1 | 0 | 6 |
| 2010 | 17 | 9 | 20 | 17 | 8 | 10 | 0 | 1 | 10 |
| Total | 310 | 185 | 455 | 272 | 136 | 268 | 38 | 49 | 187 |