This is another post that is a supplement to the piece I’m revising about the Jena 6 protest in 2007. That piece will be published by the Cambridge Elements Contentious Politics series. The goal is to use Google Trends to see if I could determine whether any of the early publicity about the case made a difference in the trends. To recap, the boys were overcharged in December 2006 and the efforts to draw attention to the case and gain support built during 2007, culminating in a big rally in Jena on September 20. Various claims have been made about who or what was most important in drawing attention to the case. The conclusion is that the impacts of the efforts on Google Trends were small but growing between mid-June and mid-August, when the mid-August call for a September 20 protest and the involvement of national civil rights leaders and radio hosts lead to a larger increases after August 20, and that the publicity events that seems to have had the biggest impact before August were an article in BlackAmericaWeb.com on July 1 and the Democracy Now broadcast on July 10.
This blog uses methodological information about Google trends which I learned from people who kindly responded on BlueSky including Andrew Mercer who pointed me to a very useful methods section in a Pew Report, Galen Stocking who chimed in on the discussion with Mercer, Florian Keusch, who pointed me to a methods article he coauthored , and Marcus Mann who suggested Google AdWords as an alternate in a paper he wrote (a suggestion I didn’t take). It turns out that if you want to study searches for rare trends for narrow date ranges, you need to take multiple samples. Google trends is a 1% sample that refreshes every 24 hours and results are scaled so that 100=the largest value observed for the searched term(s) in the time range. Rare terms may randomly appear so that they are either 100 or 0 within a small time frame. If a rare term is searched alone, you may get zero hits or one date scored 100. If a rare term is searched with more common terms, its maximum may be very small, and if it is searched with very more common terms in the that time range, it may show a 0 when there would be a non-zero value if searched alone.
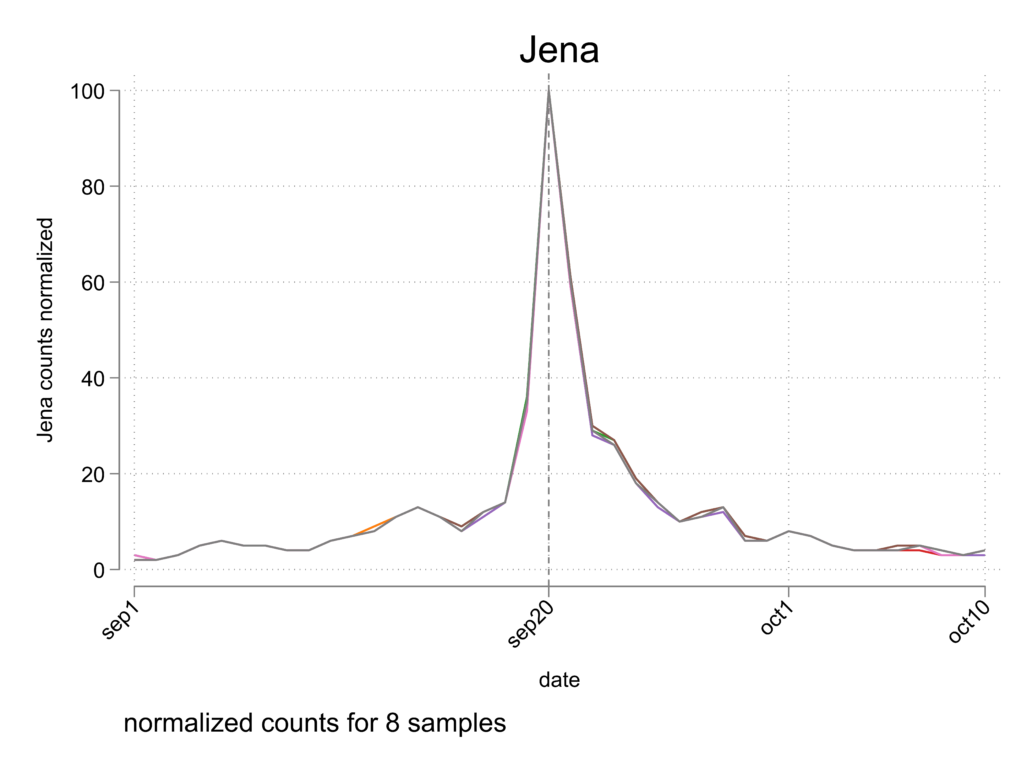
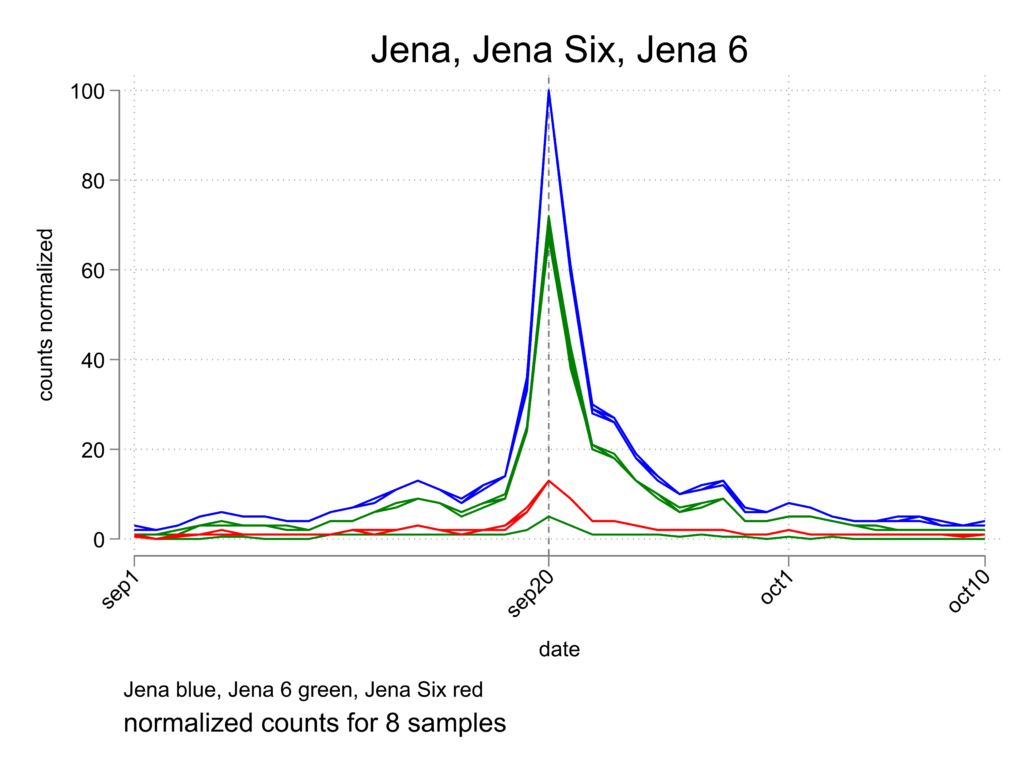
First, let’s take a look at what happened around the time of the September 20 rally, when there was a media cascade. I have eight daily samples plotted on this graph for the 19 days before and after September 20. There is observable variation but the variation does not obscure the obvious pattern that searching spiked around September 20, rose more gradually before the spike and declined more gradually after the spike.
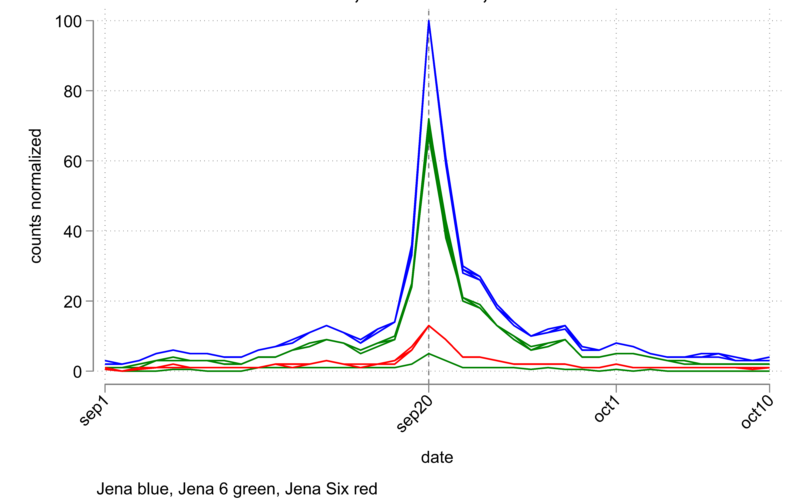
It is instructive to look at three search terms together, Jena, Jena Six, and Jena 6. The name “Jena Six” was used more commonly in mainstream media and “Jena 6” more commonly in Black news sources. Two things. First, you can see there are variations in the searches where the lines do not overlap perfectly, but the overall patterns are the same from search to search. The graph also shows that the search term Jena 6 is much more common than Jena Six at the peak of the rally, with smaller differences before and after the rally. But what about that one stray green line that is a lot lower? Most likely it was an error in entering the search term into Trends, which I did manually. For some search terms, Trends offers you a choice of “search” or “topic.” It will offer the “topic” option for Jena 6 and Jena Six. The topic choices return many fewer hits than the search terms. But after I have downloaded the file, the column names are the same regardless of which option I chose.
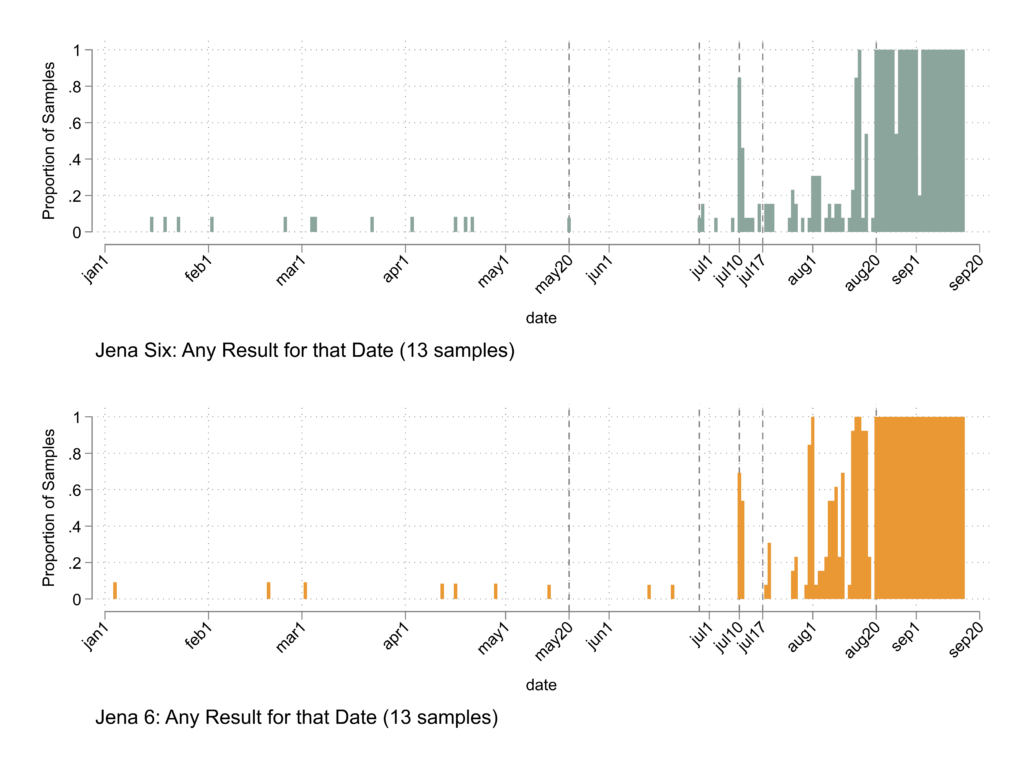
The terms Jena Six and Jena 6 are rare terms even in early September and before late August are so rare that they often do not appear at all on many dates in the 1% sample. We can begin by assessing the proportion of samples in which one of these terms had some non-zero count between January 1 and September 15. The plots show that Jena 6 consistently has enough searching to show up in all samples after August 20 and Jena Six shows up in most samples after August 20. There are also days where both terms show up in most samples beginning on July 10, with more such days after August 1, especially for Jena 6. There is a sprinkling of dates for which one sample had some non-zero return for the terms prior to July 1 but no date before July 1 when more than one sample had a non-zero return. The vertical lines mark significant dates. May 20 is the publication of the Chicago Tribune and BBC pieces about the case. There is no detectable increase in searching for these terms after that.
Mychal Bell’s trial and guilty verdict were June 26-28 and there may be an increase in searching for Jena Six on July 1. Tom Joyner’s BlackAmericaWeb.com posted a story about the trial on July 1. July 10 is the date of the Democracy Now broadcast about the case, and both search terms show evidence of an increase on that date. July 17 was the day of the first Color of Change email about the case, and there does seem to be a short-term burst in searching after that.
News coverage of the case increased at the end of July, there was a rally in Jena attended by several hundred people on July 31, and Al Sharpton came to Jena in the first week of August. There is definite evidence of increased searching in line with these events.
But the clearest and most persistent increase happens after mid-August. The call to protest in Jena on September 20 was first publicized around August 15 but it took a while for news media to pick up the story. The August 20 rise could be due to the fact that the Jena case was covered by two high-circulation weekly magazines with August 20 publication dates, the mainstream Newsweek and the Black-centric Jet.
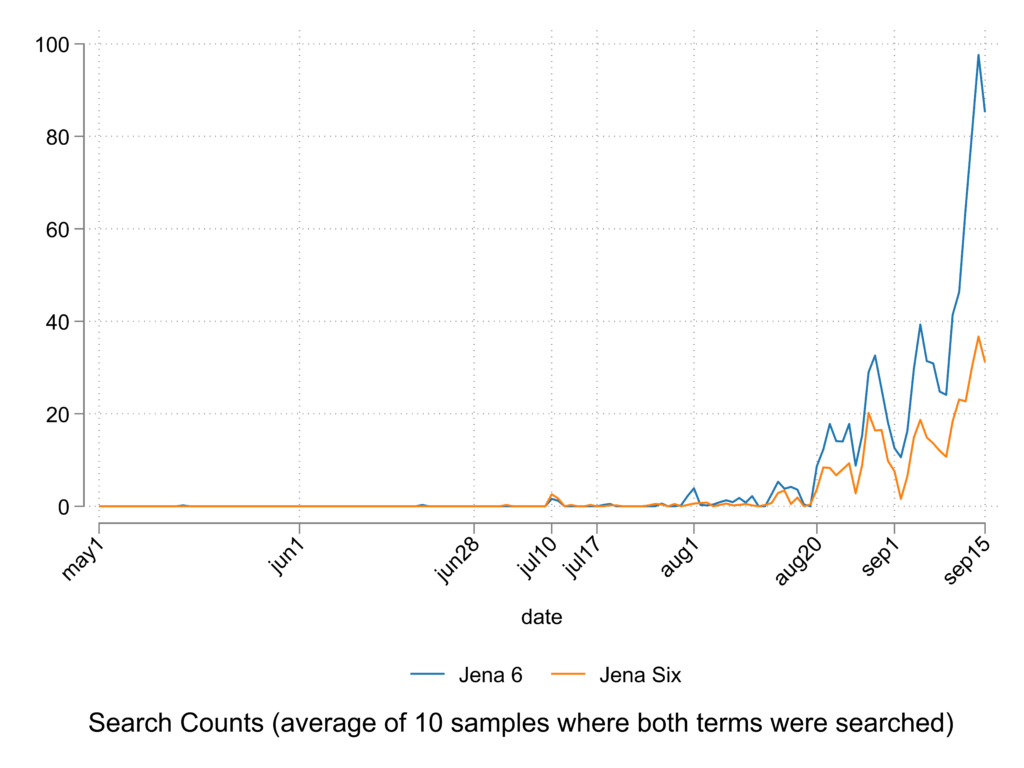
Looking at the volume of searches and not just the presence/absence of searches for these two terms, we can see that the searching before mid-July is barely measurable and that searching increases in August and escalates in September. It also shows weekly cycles and shows searches for the term Jena 6 pulling increasingly away from Jena Six in September. There is a definite rise after August 20, and another on August 28.
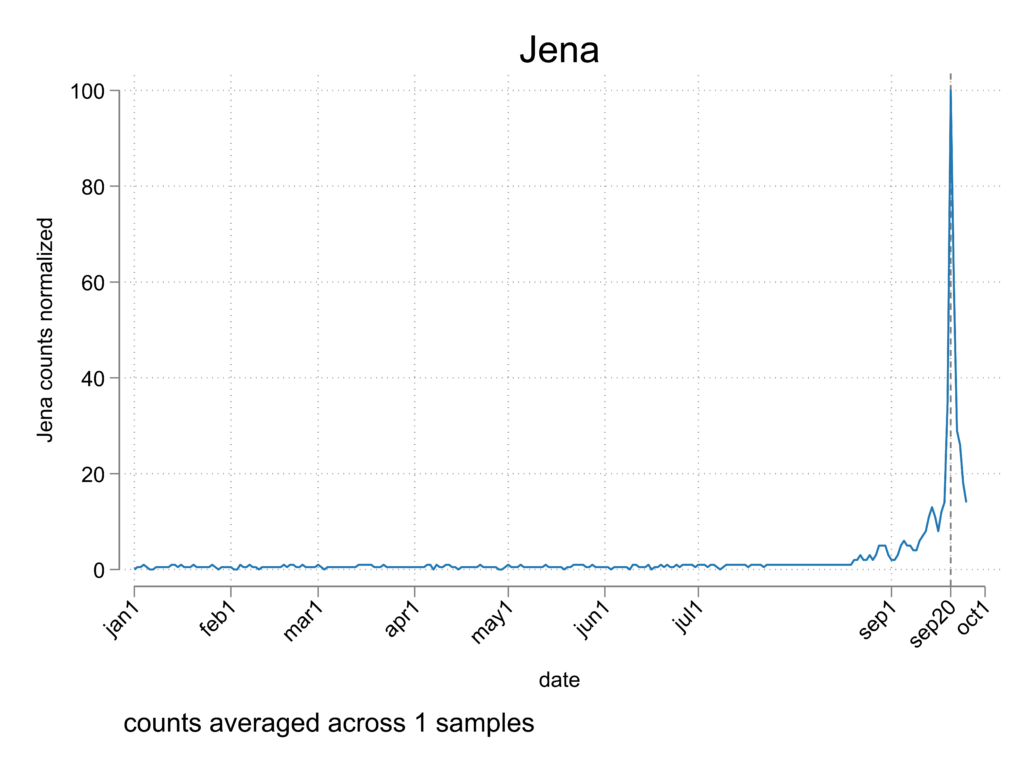
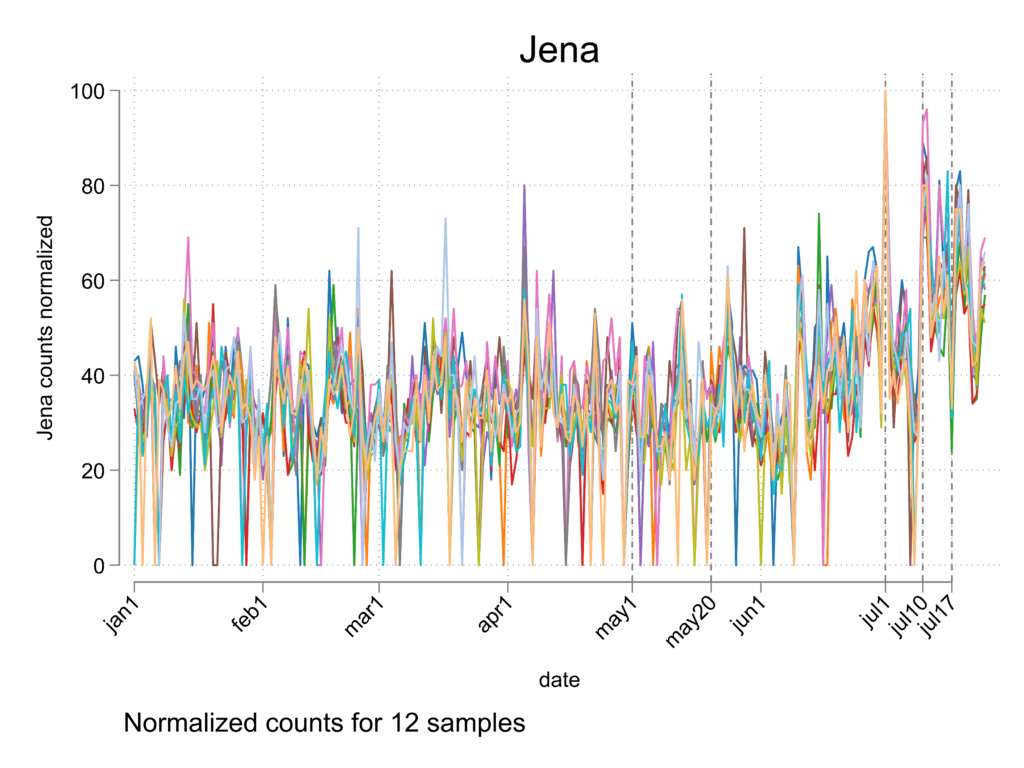
But of course people may have searched for information about Jena without using the specific search terms Jena Six or Jena 6. The term “Jena” has many common referents that appeared in the news for a variety of reasons in 2007, including the Jena band of the Choctaw, a city in Germany and the pharmaceutical company bearing its name, and many people with the name who appeared in the news. The plot for January through September 25 shows the overall pattern.
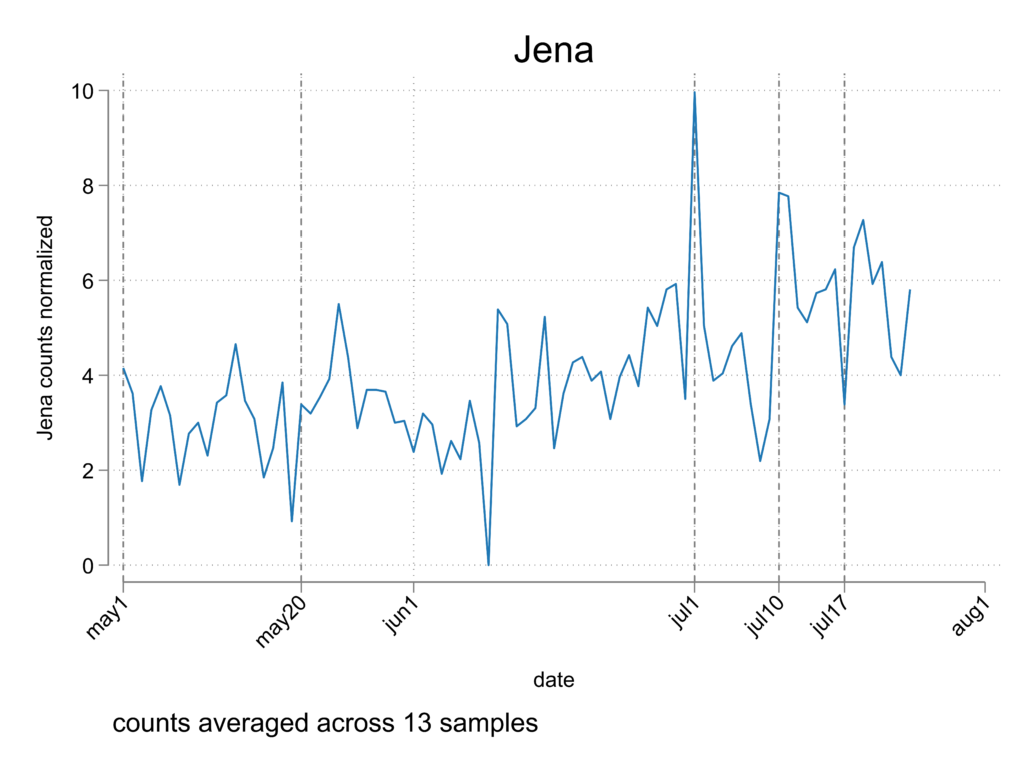
If we plot searches for “Jena” from January through mid-July, we see that there is a lot of sampling noise including a fair number of days for which some samples returned zero results.
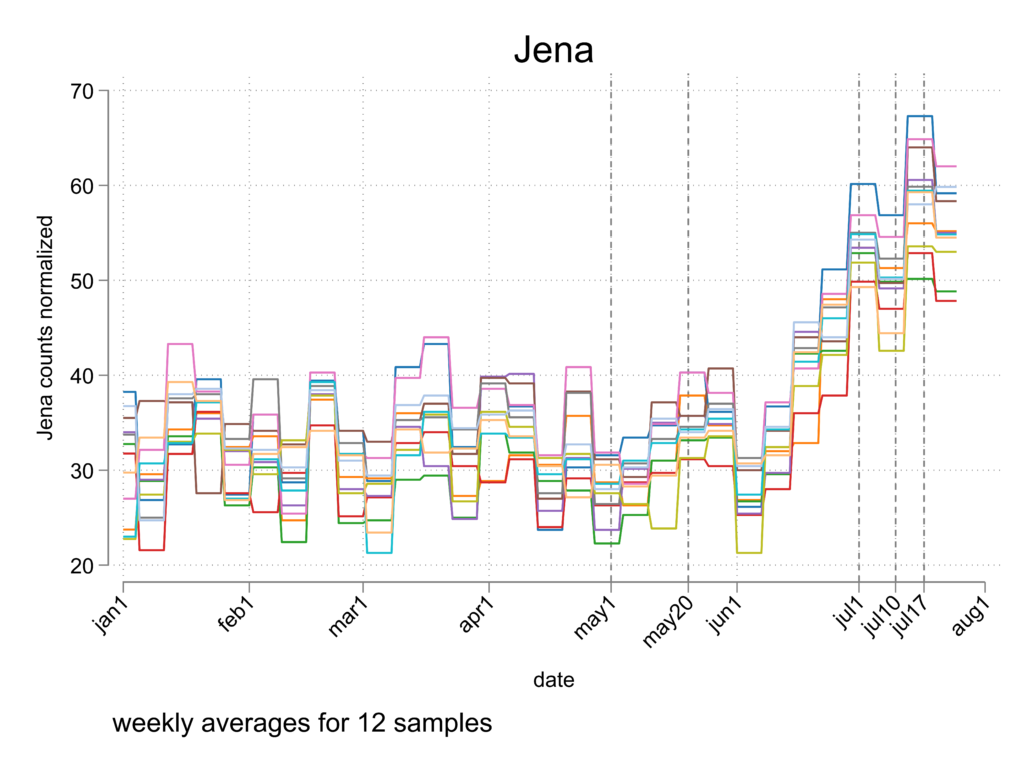
Taking weekly averages also shows substantial sampling variation as well as a clear upward trend beginning in late June, as Mychal Bell’s trial approached, and generally continuing into July. Even though people in Jena were experiencing a sense of unwanted outside notice after May 20 (as reported in articles in the Jena Times and the Alexandria Town Talk published in June), this does not seem to translate into detectable increases in Google Trends until mid-June.
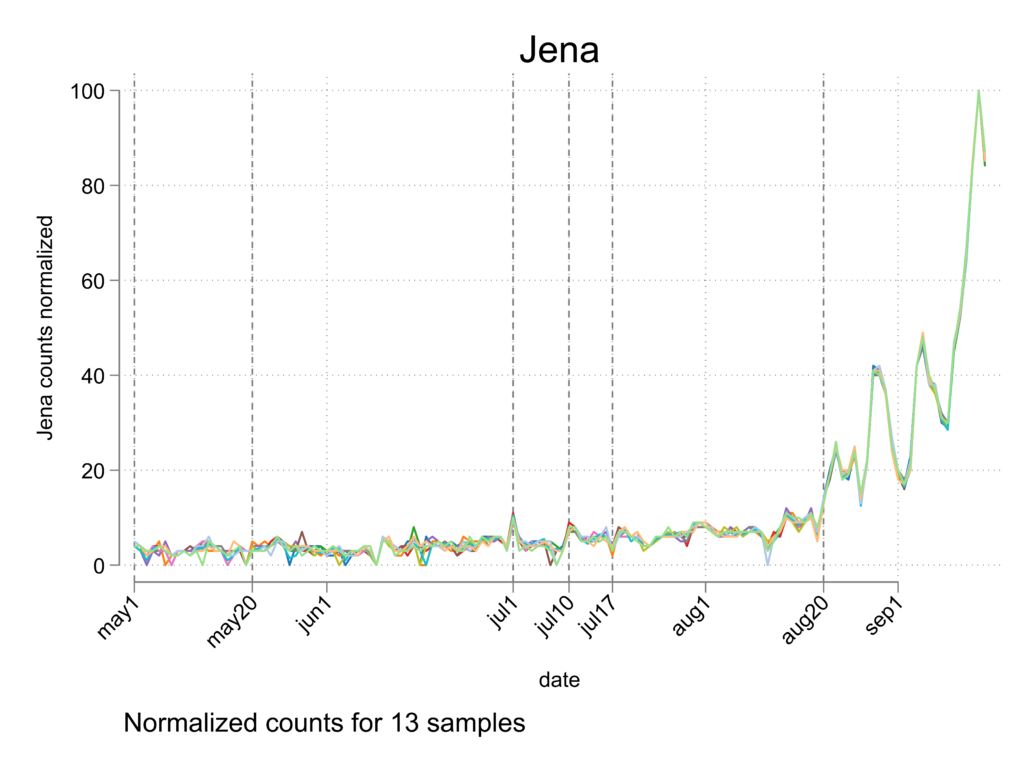
Trying to get a better focus on the specific question of the impacts of early events, we narrow in more on the time after May 1. First it is helpful to put the rises in June and July into context, where it is obvious that the big take-off point is late August. There is a clear bump after August 20, the date of the Newsweek and Jet articles, and then another bump around August 28 and another September 4 and then things just start escalating. But there do appear possibly to be significant spikes of interest around key dates in July.
Narrowing in on the period between May and late July, there is definitely a July 1 spike (the day of the BlackAmericaWeb.com story) and probably a July 10 spike (the day of the Democracy Now broadcast) and maybe short-term increases after May 20 (the Witt and Mangold stories) and July 17 (the Color of Change emails).
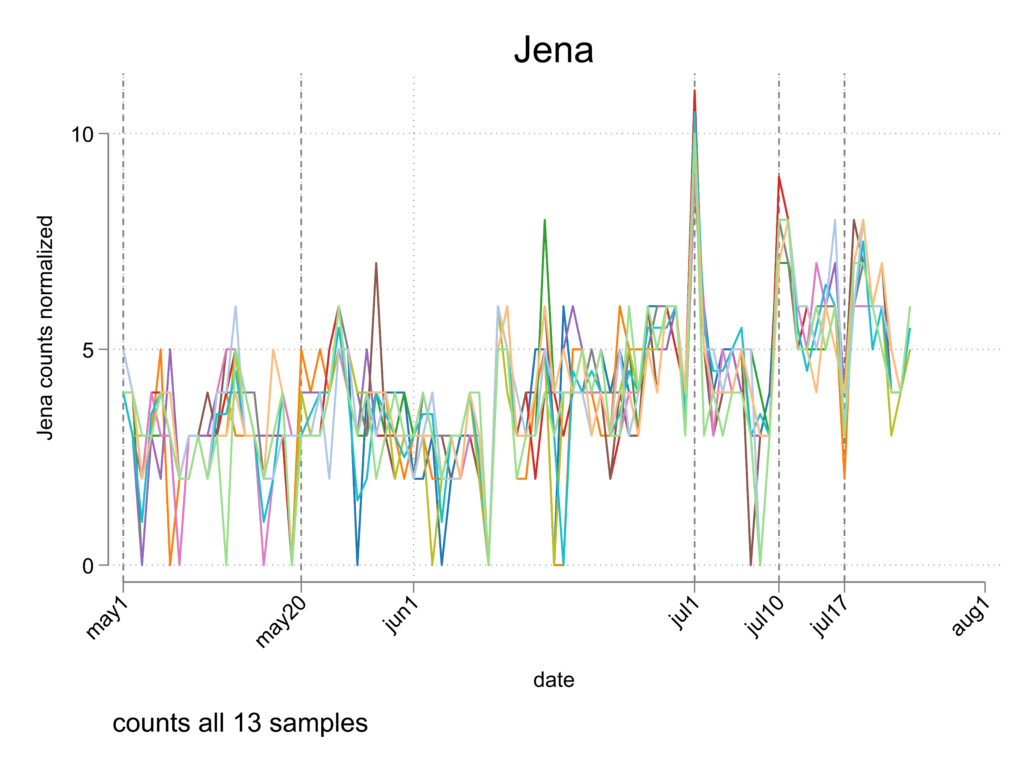
Looking at the average across samples, besides these apparent short term increases after May 20, July 10 and July 17, and the July 1 spike, we can see the gradual increase in the second half of June.
So what have we learned from this exercise? The communication about the Jena case was happening from the beginning in late December 2006, but it is hard to detect any definite influence of the diffusion of information before the upward trend in the latter part of June, the slow increase in July and early August, then the greater increase in later August escalating into September. There is a clear short-term spike on July 1, the day the case was mentioned on BlackAmericaWeb.com. We know from other sources that the Nation of Islam and the Millions More Movement became involved as a result of a member hearing the Democracy Now broadcast and its date of broadcast, July 10, seems to be a consistent spike. There is also some evidence of a spike after July 17 when Color of Change sent its first email.
Comparison to Genarlow
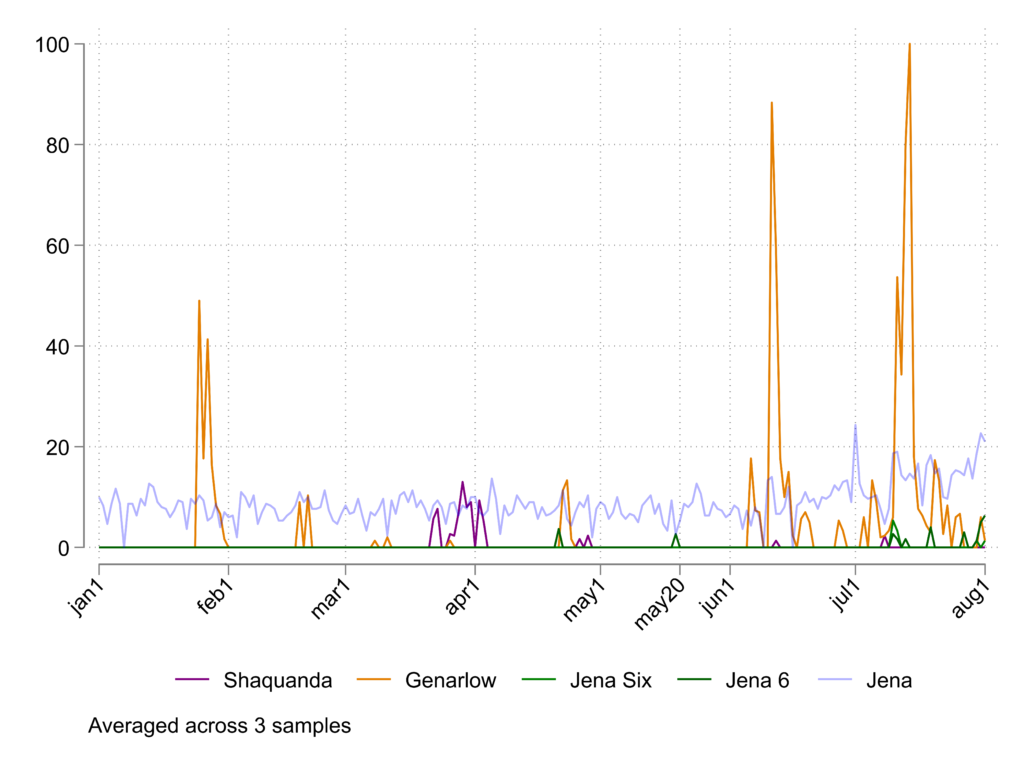
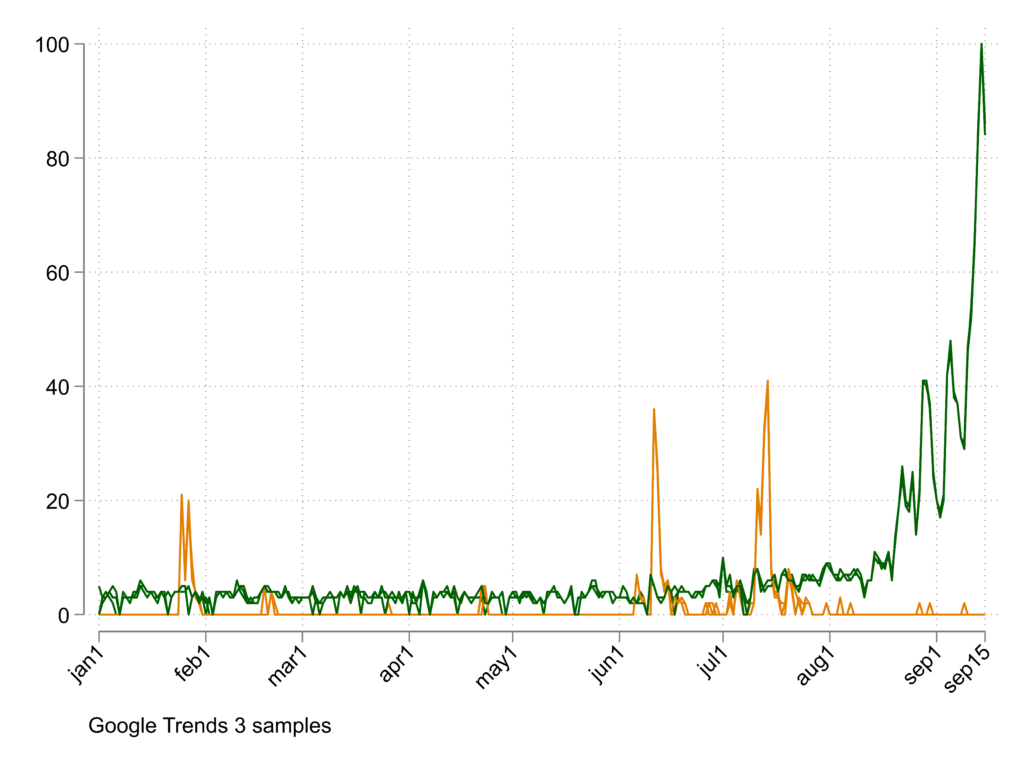
As I have discussed in previous posts, during 2007 there was another case of unjust prosecution of a Black teen. Genarlow Wilson was sentenced in 2006 to ten years in prison for being the recipient of consensual oral sex at a drunken party from a 15 year old girl when he was 17. Major Black activists and groups including Al Sharpton and the NAACP were speaking out about the case. Although there is no baseline non-zero level of searching for the keyword Genarlow, there are several significant bursts of Google searches for the name prior to August 2007, and these bursts are substantially larger than the small spikes we have been identifying for the Jena case prior to late August. Then around September 1, searching for Jena explodes and comes to dwarf the attention paid to the Genarlow Wilson case.
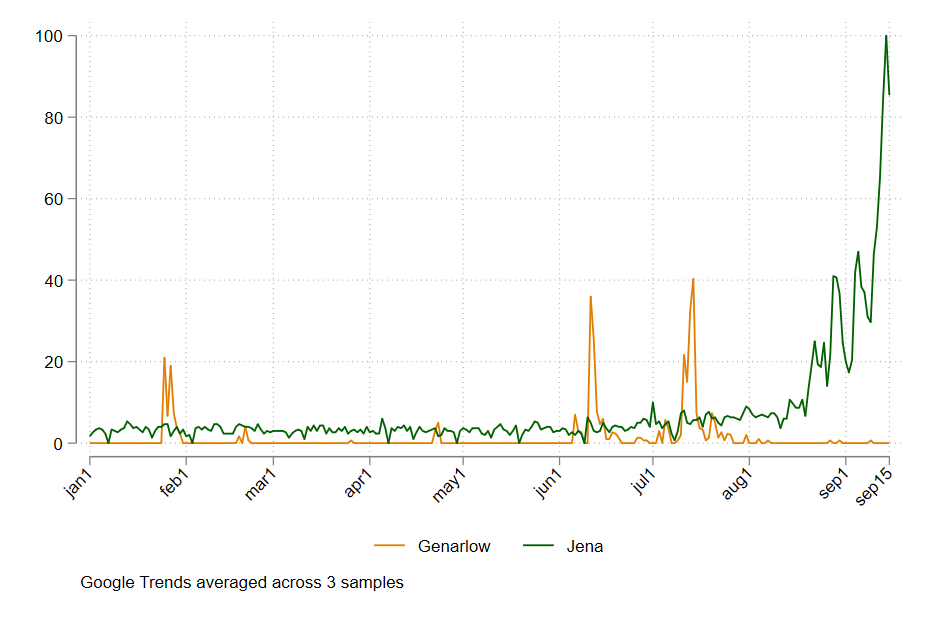
As seen below, the plot of the three samples shows sampling variation around searches for Jena, but little sampling variation around the peaks in searches for Genarlow, which is a unique search term.
Comparison to Shaquanda
It is helpful to make a comparison with another case of overcharging of a Black youth. In March 2007, journalist Howard Witt published a Chicago Tribune article about the case of Shaquanda Cotton, a 14-year-old Black girl who was sentenced to up to seven years in juvenile prison for shoving a White school aide. Witt’s story comparing Cotton’s punishment to a White girl who had received probation for arson from the same judge had received 21,000 hits and had been picked up by more than 200 blogs including AfroSpear writers within four days and led to the girl’s release by the end of March. Witt’s story about her release says “Since the Tribune’s first account of Shaquanda Cotton’s case, her story has been circulated on more than 400 Internet blogs and featured in newspapers and radio and TV reports across the country. Two protests demanding her release were held in Paris and a third, to be led by Rev. Al Sharpton, was scheduled for Tuesday.” This prior experience set up the connection between Witt and the AfroSpear bloggers for the Jena case. In the graph below, the dark purple line shows a burst of attention to Shaquanda in late March and early April, and a few small bursts later. The March burst of attention is much smaller than the attention bursts for Genarlow. However, it is much larger than the attention given to Jena Six or Jena 6 before August 1. The light blue line is for Jena which, as discussed above, has a baseline throughout this period as it captures many different things, not just the Jena Six case. The Shaquanda bursts rise to the baseline Jena level. Despite the AfroSpear attention to the Jena case after Witt’s May 20 article, we do not see a burst in attention comparable to the burst seen with Shaquanda.