
Key findings
- In Wisconsin, an estimated 35% of first spells in prison and 50-75% of second or later spells are crimeless revocations, depending on the criteria used for “crimeless”.
- A careful comparison of prison records suggests that roughly a third of prison admissions with no new sentence may have anticipated a new conviction (as indicated by a new offense showing up in the record).
- Well over half of those who return to prison within a few years of release meet the strict criteria for a crimeless revocation.
- Most crimeless revocations (strictly defined) occur in the first two years after release. Length of stay records suggest that these strictly-defined crimeless revocations truly are crimeless.
- It costs an average of $47,500 for each crimeless revocation reentry after the first spell in prison and an average of $97,200 for each first prison entry that is due to a probation revocation with no new sentence.
In support of the sentback.org campaign, in this post I provide some data on crimeless revocations in Wisconsin, 2000-2013 using the NCRP data. NCRP data are collected and processed by the federal Bureau of Justice Statistics (BJS) from data submitted by state departments of corrections. See more data notes below. Estimating the proportion of people whose admissions are “crimeless” is difficult, but it is still possible to use these data to get some idea of the magnitude of the issue.
Crimeless revocations 1: Basic coding categories
Prison admissions are classified by type: new commitment, probation revocation (with or without a new sentence), parole revocation (with or without a new sentence), mandatory release revocation (with or without a new sentence), plus a number of other administrative categories. A revocation is a return to prison that is a punishment for failing to meet the conditions of community supervision. Crimeless revocations are defined as probation, parole, or mandatory release revocations that are listed as not including a new sentence. As I summarized in my previous post, people can be revoked and sent to prison for infractions that are not crimes.
In understanding how to track crimeless revocations, it is important to begin by understanding the flow through prison and how that affects data records. Overall, each year, about 55% of all prison admissions are re-entries: the person has been in the Wisconsin prison system before. [2] This means that 45% of prison entries each year are the first time the person has been in prison.
In theory, the first time you show up in a prison record it should be either as a “new commitment” (i.e. a judge sentenced you to prison) or as a probation revocation, where the judge initially sentenced you to probation instead of prison. For the first spell in prison, the only “crimeless revocation” should be a probation revocation.[1]
Other revocations happen from community supervision after a spell in prison. In Wisconsin, less that 5% of prison releases are unconditional. Everybody else goes into a period of community supervision where they are subject to reincarceration for violations of the terms of supervision. “Parole” refers to a discretionary release; you behaved well in prison so you are let out early “on parole.” “Mandatory release” means that your sentence requires you to be let out after a certain amount of time and to finish the rest of your sentence under community supervision. In Wisconsin, this is officially called “extended supervision.” Because revocations from these are both post-prison, I lump them together and call them parole revocations. In addition, the data show an “other” category which BJS classifies as a type of parole revocation. After investigation, I have concluded this “other” is best counted as a form of parole revocation with no new sentence because it involves very short prison stays andhas a very low percentage of showing a new offense. [3]
Looking first at records for a person’s first spell in prison, the records for 2000-2006 contain a higher percentage of revocations in the first spell than later records, which would be due to revocations of people whose first spell ended before 2000 (and thus is not in the data). Looking at first spells 2007-2014, an average of 49% are a new commitment, 11% are a probation revocation with a new sentence, and 27% are a probation revocation with no new sentence. (These total 87%, versus the 100% to be expected if these are truly the person’s first spell in prison.) 12% of these first spells can be classified as a parole revocation with no new sentence, most of them the short-term “other” revocation which might also be a type of probation revocation, while less than half a percent each are parole revocations with new sentences or administrative categories like transfer. Overall, 39% of first spell admissions in the data appear to be “crimeless revocations,” 27% probation revocations with no new sentence and 12% parole revocations with no new sentence. The graph shows that the proportion of first admissions to prison that are crimeless revocation (line 1a in the graph) fell somewhat after the mid-2000s, due almost entirely to a drop in parole revocations as a source of first admissions which, in turn, is probably due to data censoring (that is, not having access to the person’s actual first record).
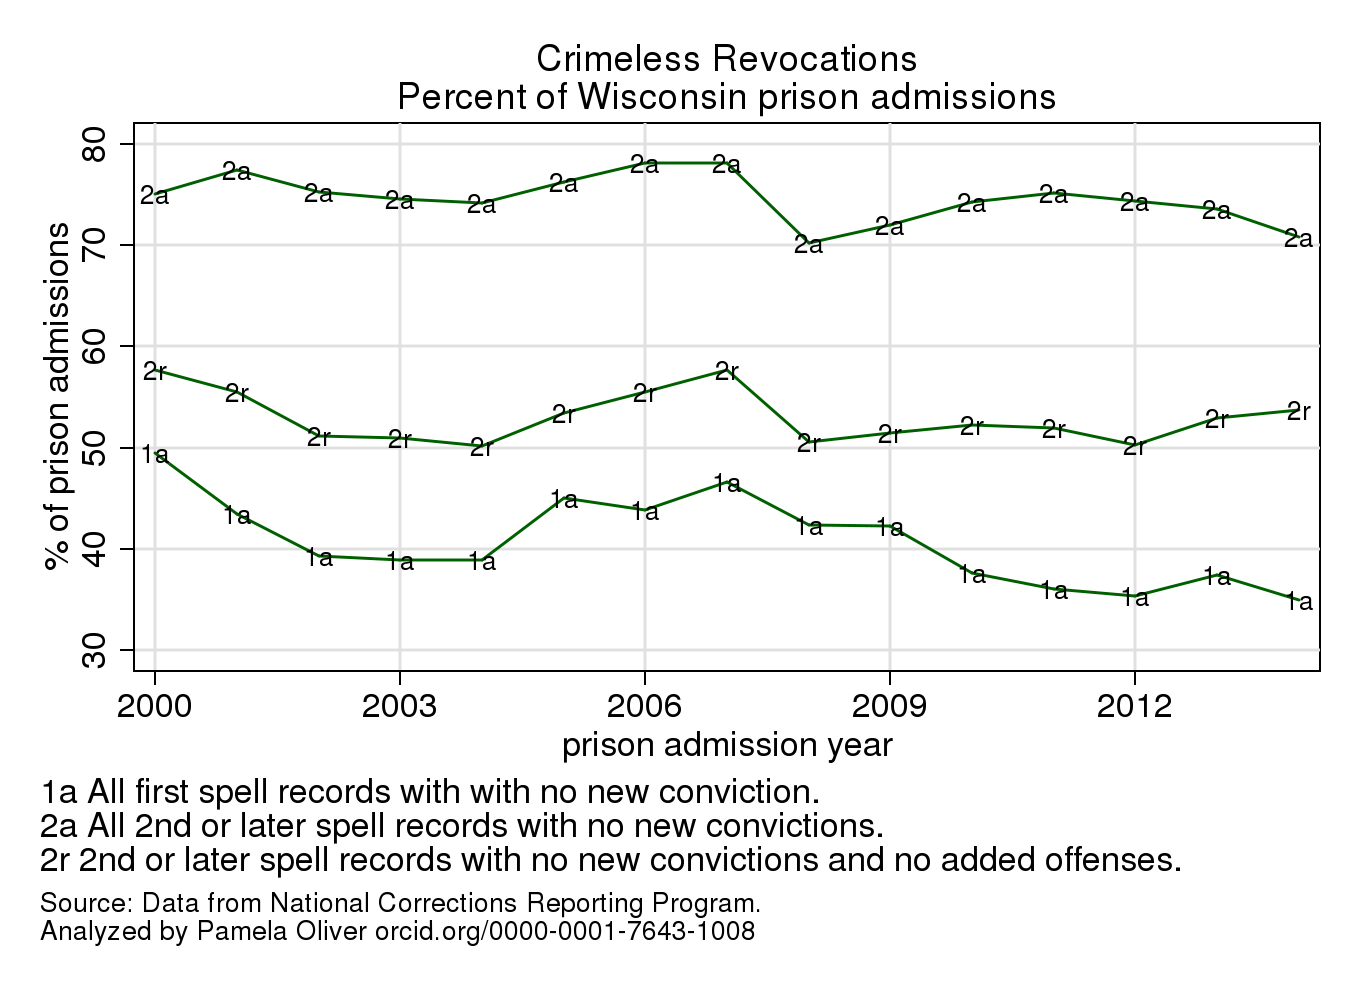
Looking at second or subsequent spells in prison, the proportion who enter on crimeless revocations is much higher (the 2a line in the graph), overall 74% of all prison admissions for second or later spells since 2004, a proportion that has been pretty steady for over a decade.
Crimeless revocations 2: Refining and Defining
Many people who work in “the system” say that some of these “crimeless revocations” really involve prospective crime convictions. That is, the person is revoked while adjudication for a new crime proceeds. To check this possibility, for each person who was a re-entry, I checked to see whether the crimes listed for them had changed between their last spell in prison and this current “crimeless” entry. It turns out that there are new offenses listed in the NCRP records for nearly 30% of the “crimeless” revocations for re-entering inmates. Exactly when and how these charges got entered into the record that was sent to NCRP is not clear. The proportion of “no new conviction” records that had added offenses was pretty consistent across years after 2005 (compare lines 2a and 2r over time).
Using this more restrictive definition, 53% of the re-entry admissions after 2006 were crimeless revocations, a proportion that has not varied much more time (see line 2r in the graph). In short, even by a more strict criterion of “crimeless” revocation, well over half of all re-entry prison admissions were crimeless.[4]
Time in prison on crimeless revocations
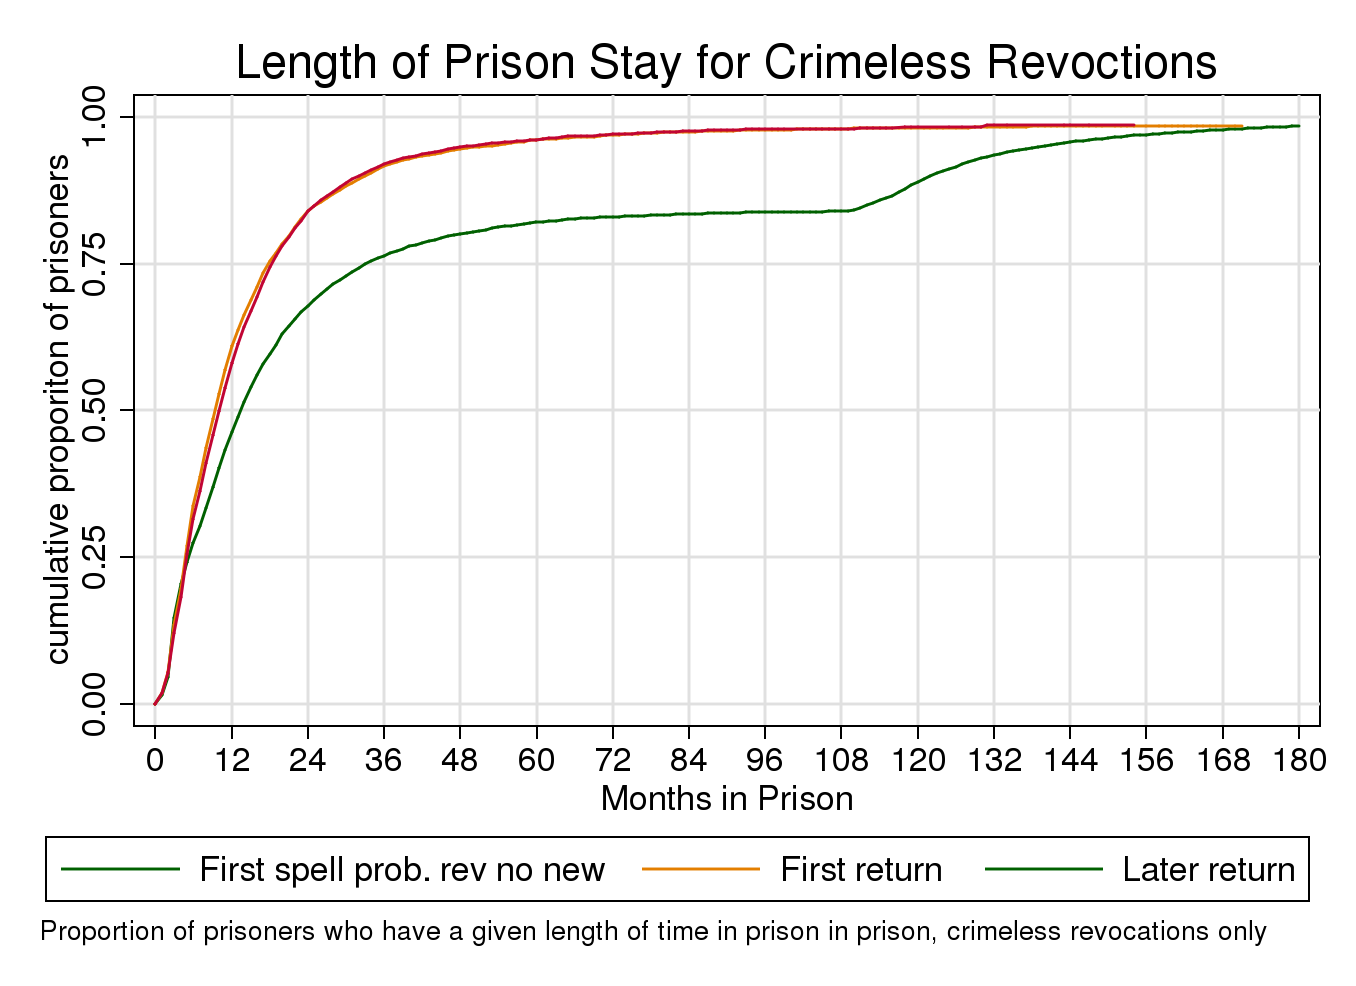
As my post on time served shows, people spend less time in prison if they enter on a crimeless revocation. People who reenter prison on a strictly-defined crimeless revocation have a median stay of 10 months and an estimated mean of 17.5 months. People whose first prison entry is a probation revocation with no new sentence have a median stay of 14 months and a mean stay of 36 months. These short stays in prison are long enough to disrupt their integration into society and are expensive. It costs $2700 a month to incarcerate a man, more for a woman. This means it costs an average of $47,250 (17.5x$2700) for each crimeless reentry revocation, and an average of $97,200 ($2700×36) for each probation revocation that sends someone to prison who has not previously been incarcerated.
Trajectories
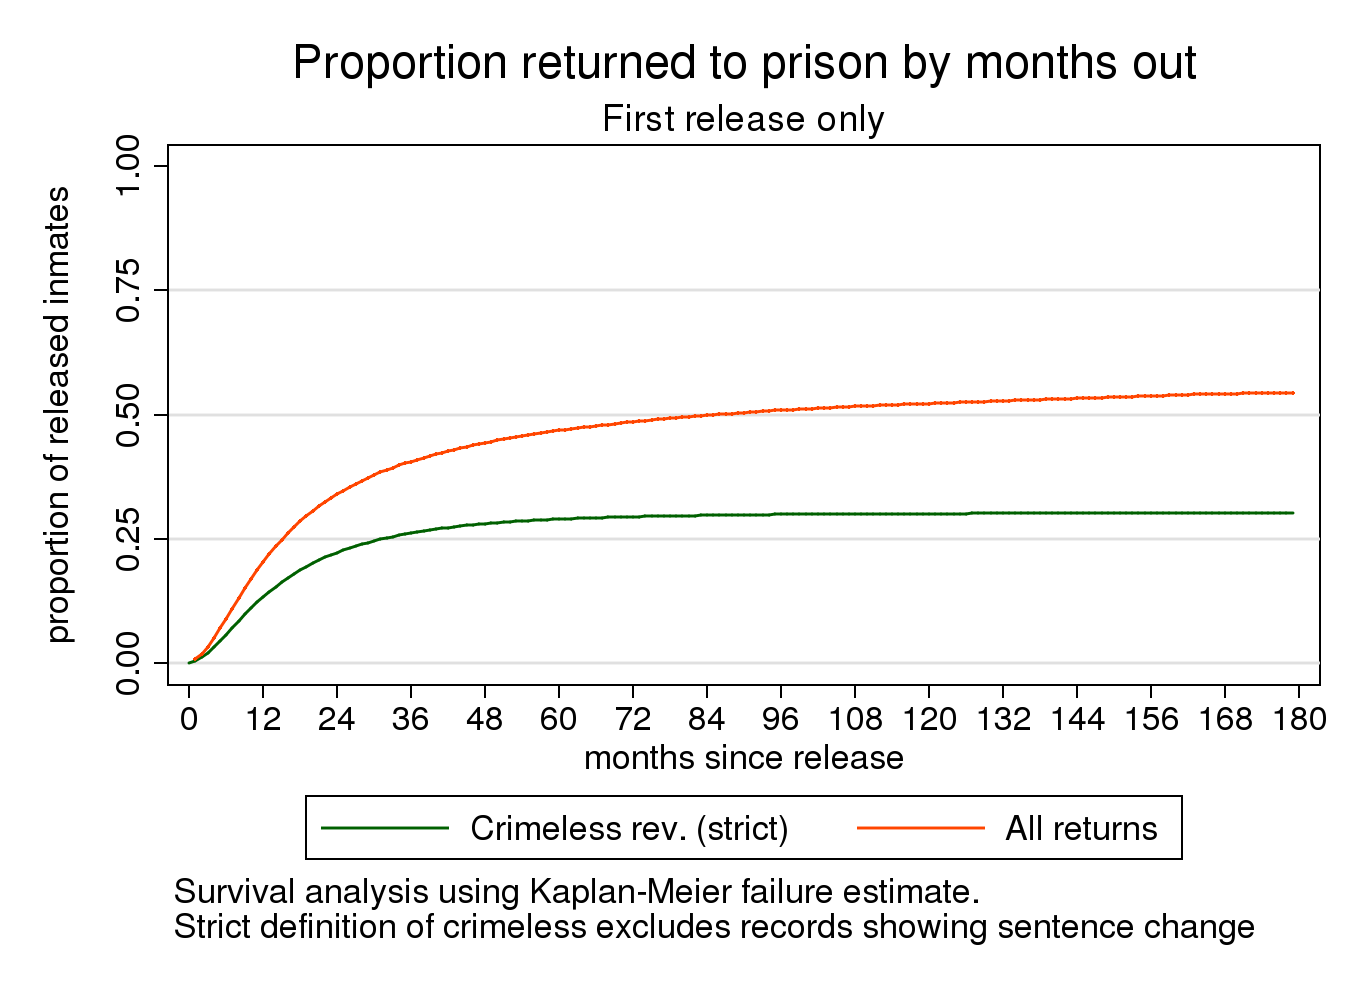
A survival analysis considers people released from prison and asks how long before they “fail” and reenter, in this case on a crimeless revocation, using the strict definition.
Looking first at first releases from prison and focusing on the 95%+ who are released conditionally, a little over 50% ultimately return to prison and about 27% return on strictly-defined crimeless revocations. The crimeless revocations occur faster, which can be seen by the narrow gap between crimeless revocations and total returns in the first few months. Crimeless revocations mostly occur in the first two years, while returns involving new crimes take longer.
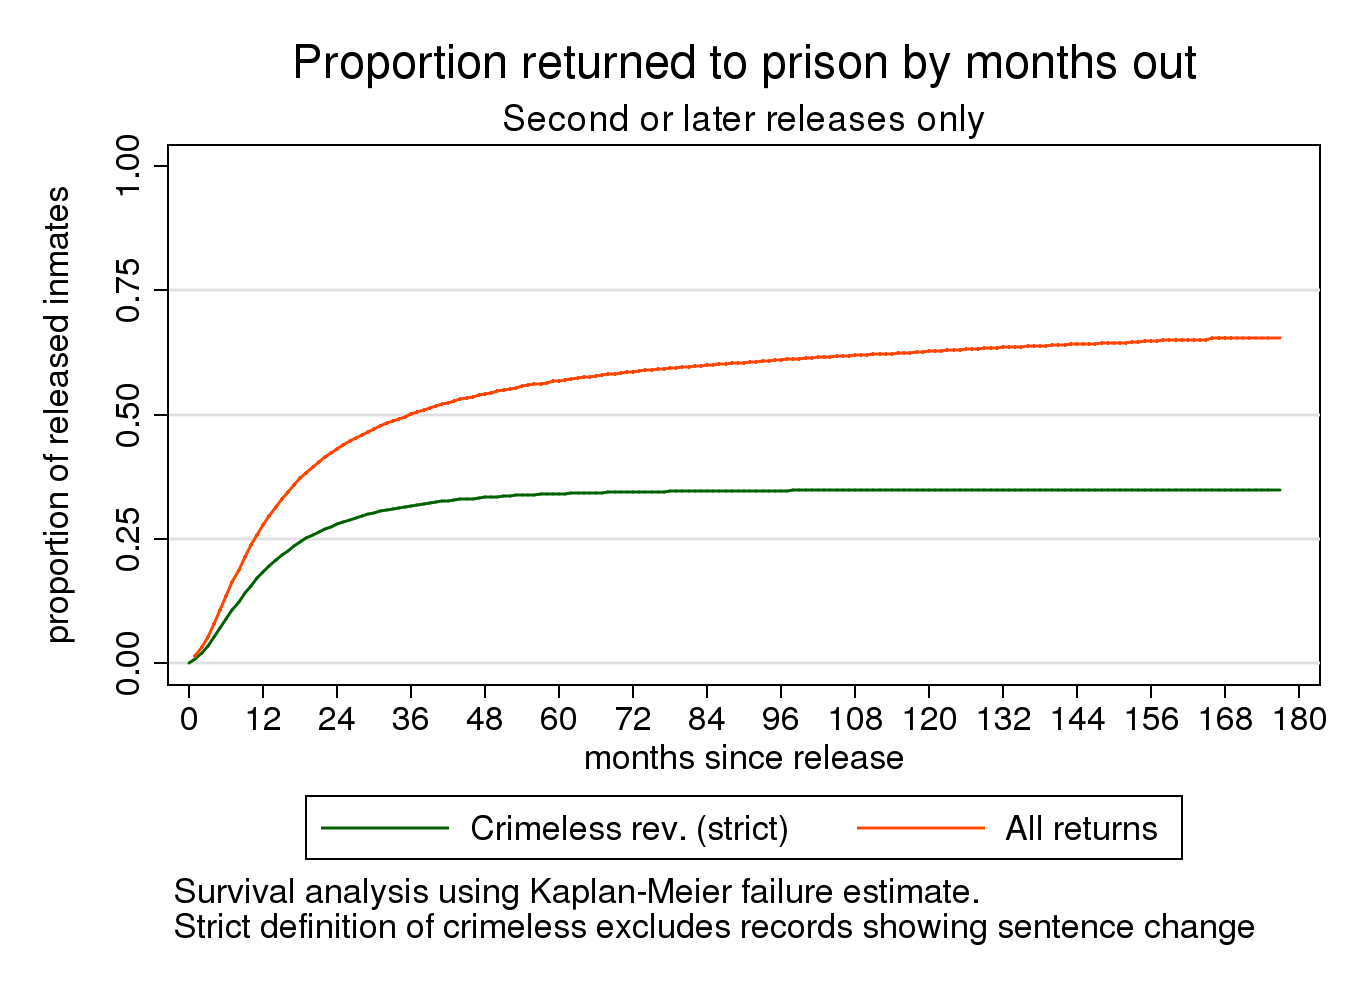
Looking at second or subsequent releases, the first thing to notice is that the overall rate of return is higher, but the second thing to notice is that the gap between first and second returns is higher for returns involving new sentences than those not.

If you look at why the person spent a second spell in prison, those who entered on crimeless revocations (using the strict definition of no new offense in the record) and then were released again, had a higher percentage of being returned to prison again for a third time (49.5%) than those who entered spell #2 with a new crime on their record (45.5%). Looking at number of spells and time served, the people who experience crimeless revocations are churning in and out of prison on short stays and accumulate less total prison time in their stays than those who have new crimes added to their records.
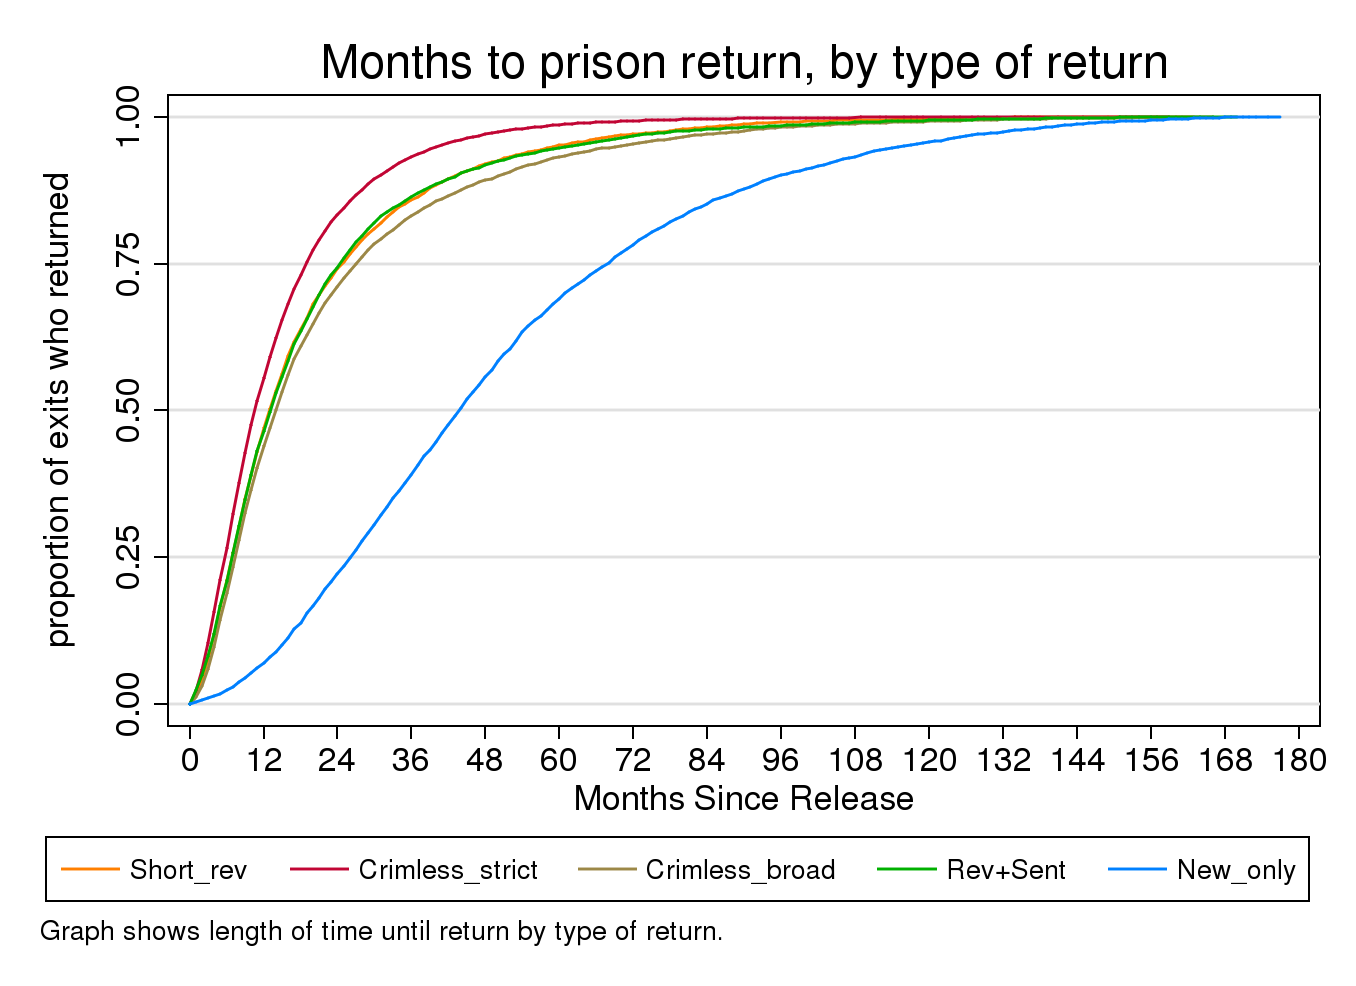
The following graph is based only on the people who returned to prison after release (excluding those who got out and stayed out) and shows how long it took them to be returned. People who are returned for new sentence only with no revocation take longer to return, presumably because they first have to work off their period of community supervision to be in the category of not being revoked. Everyone else who returns to prison has some type of revocation. The graph shows that all revocations tend to happen within the first two years, but the crimeless revocations happen much more rapidly than those involving new sentences or even the short other revocations. The graph also suggests that those returned to prison with the category “no new sentence” but have an added offense in the record are more similar to those who are revoked with a new sentence than to those who meet the strict criterion for “crimeless” revocation in terms of length of time before revocation. This graph combines first and later returns; later returns happen even faster than first returns, but the graphs are similar in their basic shapes.
Sources, notes
The source of these data is the National Corrections Reporting Program file #36373 available from ICPSR. These data are restricted; you have to obtain IRB approval and file a confidentiality plan with ICPSR to use them. The data come from state departments of corrections, so the original source of the data is what the Wisconsin DOC deposited with the NCRP. I exclude records in which a person has the same prison entry and exit dates in a record, as these typically mark transfers or shifts in custody status rather than true entries into and exits from prison.
Notes
[1] Some states actually record probation revocations as new commitments in their NCRP report. Because the data start at a certain point, in this case 2000, the first record isn’t necessarily the person’s first time in prison. It is also possible for a person to have previously been incarcerated in another state.
[2] Because the data start in 2000, there are a lot of “first” records that are actually returns to prison. But from about 2006 on, the percent that are new records each year stabilizes at about 55%, with no visible time trend after that point.
[3] The “other” category has an unusually short average time served relative to other types, is typically preceded by a conditional parole release from prison, and has a much lower likelihood of having new offenses added to the record than other admission categories. This appears to be some sort of short-term revocation that does not include a new conviction, so I classify it with the other forms of crimeless revocation.
[4] I also looked at whether the sentence length changed. For non-first spell revocations admissions classed as including new sentences, 52% have no sentence length change, 17% show a shorter sentence and 31% show a longer sentence. For non-first spell revocation admissions classed as crimeless by the strict definition, 85% show no change in sentence length, 6% show a shorter length and 9% show a longer length. Although the 9% with a longer sentence length might be thought also to have a new sentence, this could also be due to administrative penalties added or coding errors.
4 comments