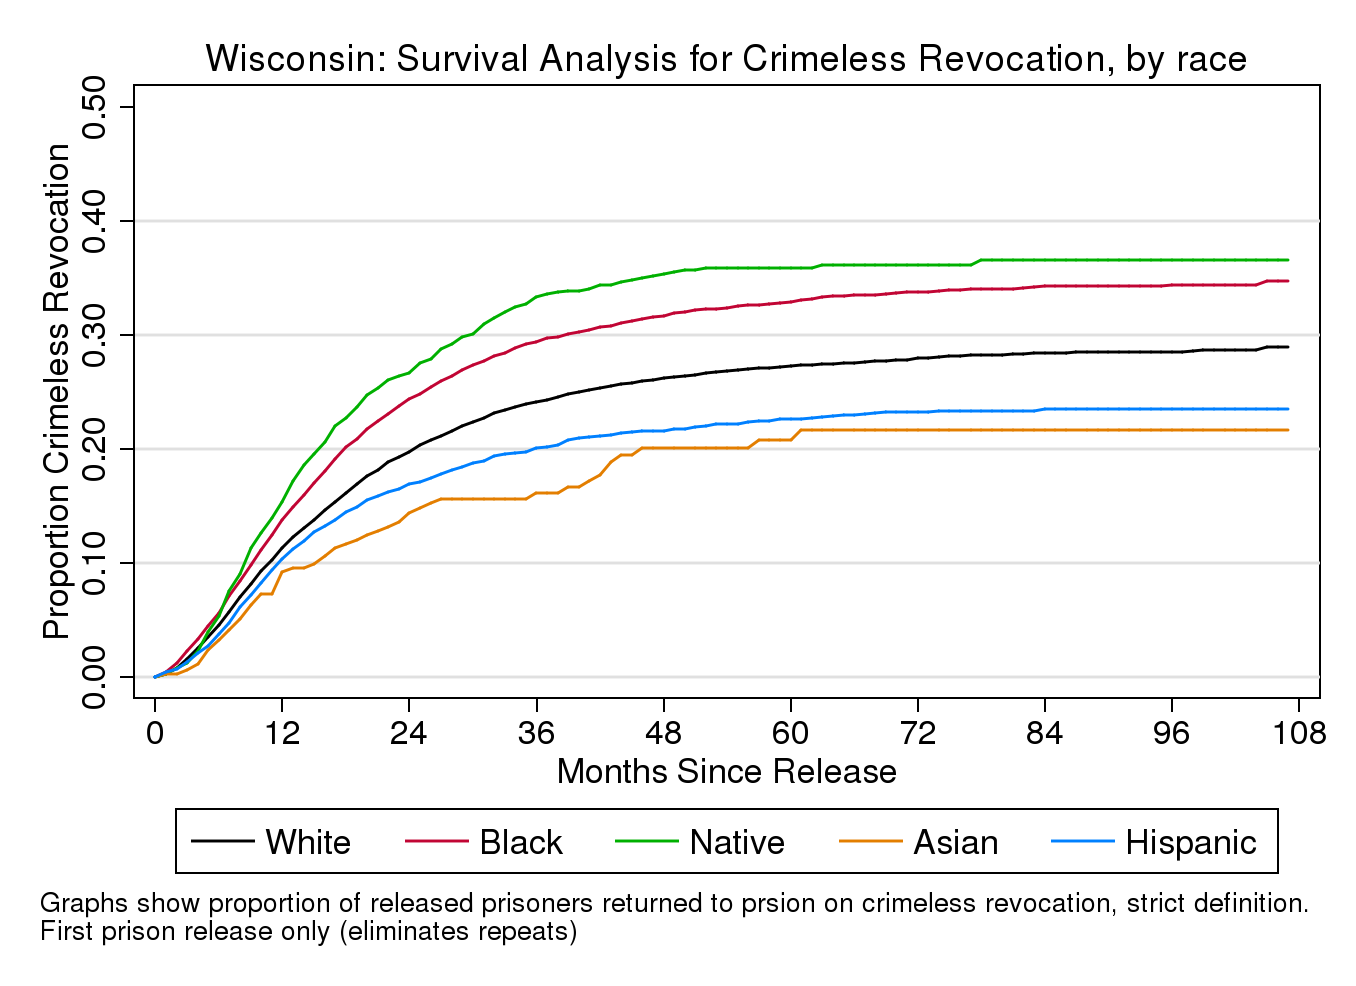
Key findings: Of those leaving Wisconsin prisons for the first time, Native American Indians have about a 30% higher rate of crimeless revocations than Whites, and Blacks about 20% higher (comparable to disparity ratios of 1.3 and 1.2) while Hispanic and Asian revocation rates are lower than White. For second and later releases, there is little racial difference in revocation rates.
My previous post established that crimeless revocations are very common in Wisconsin prisons, roughly a third of first spells in prison and over half of re-entries to prison, even after reducing the estimate by taking account of information in the record suggestive of a post-revocation conviction for a crime committed before revocation. But are there racial disparities in these patterns?
Just examining the prevalence of revocations in prison admissions for different racial groups won’t do the trick, because you don’t know whether a high proportion of crimeless revocations is due to that group being revoked a lot or not committing so many new crimes. Instead you have to consider the revocation rate among people at risk of revocation.
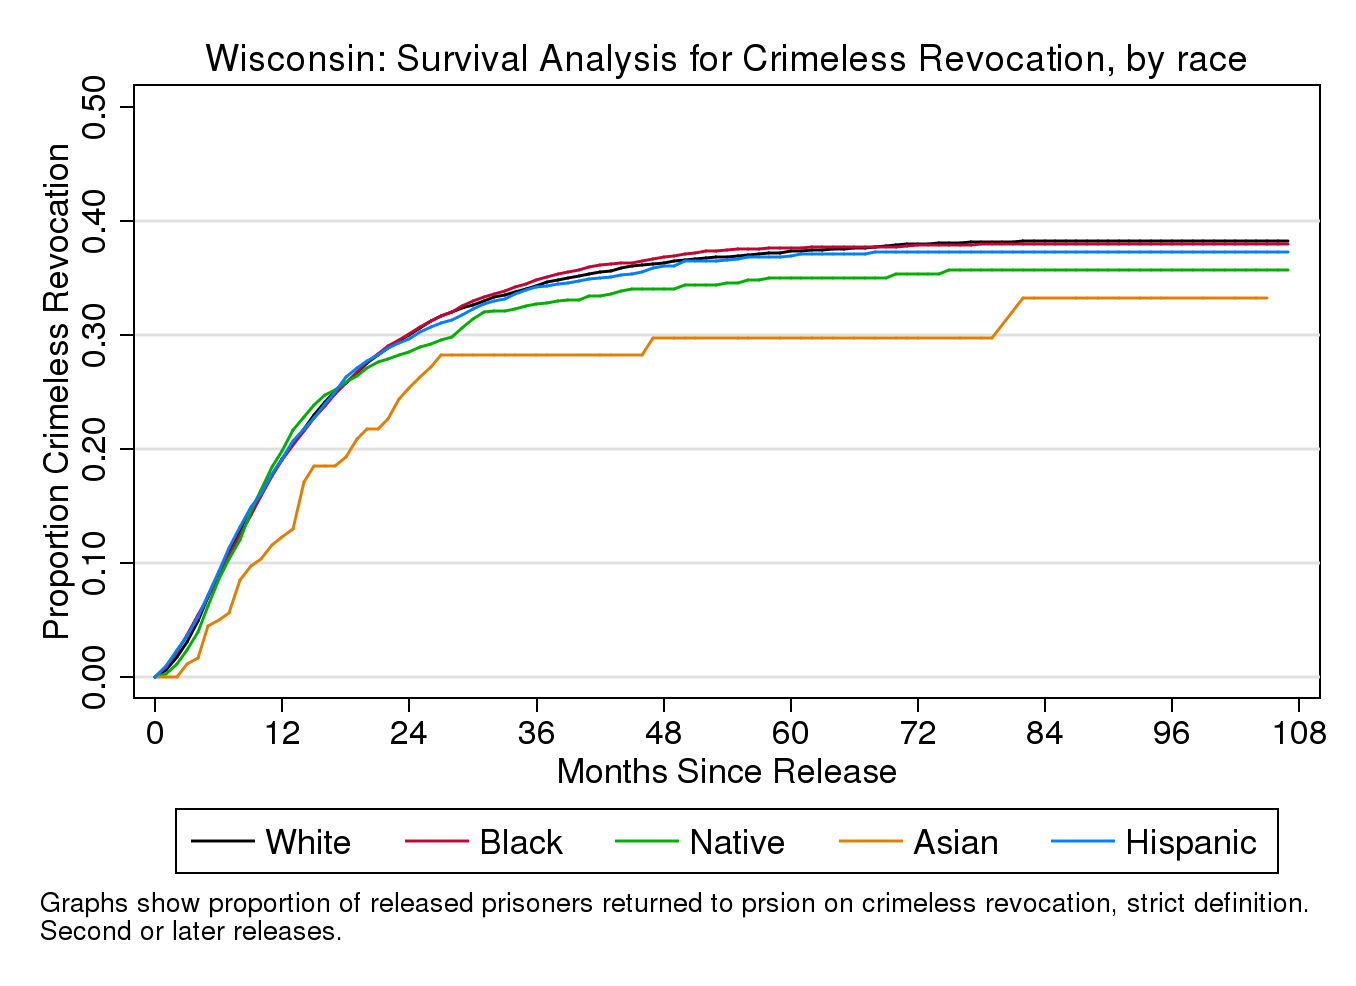
First, let’s consider re-entry. Almost everyone (over 95%) who exits a Wisconsin prison goes into community supervision where they are at risk of a revocation for violating the terms of supervision, even if they do not commit a new crime. We can address the question of racial disparity with what is called a survival analysis, where we see how long people stay out before being revoked. A survival analysis adjusts for the fact that people who have been recently released have had less chance to be revoked yet and might still be revoked in the future. This analysis only considers the 95% who were released to community supervision. Overall, Blacks and Native American Indians end up with about a 15% higher rate of crimeless revocations than White, while Hispanics and Asians have lower rates.
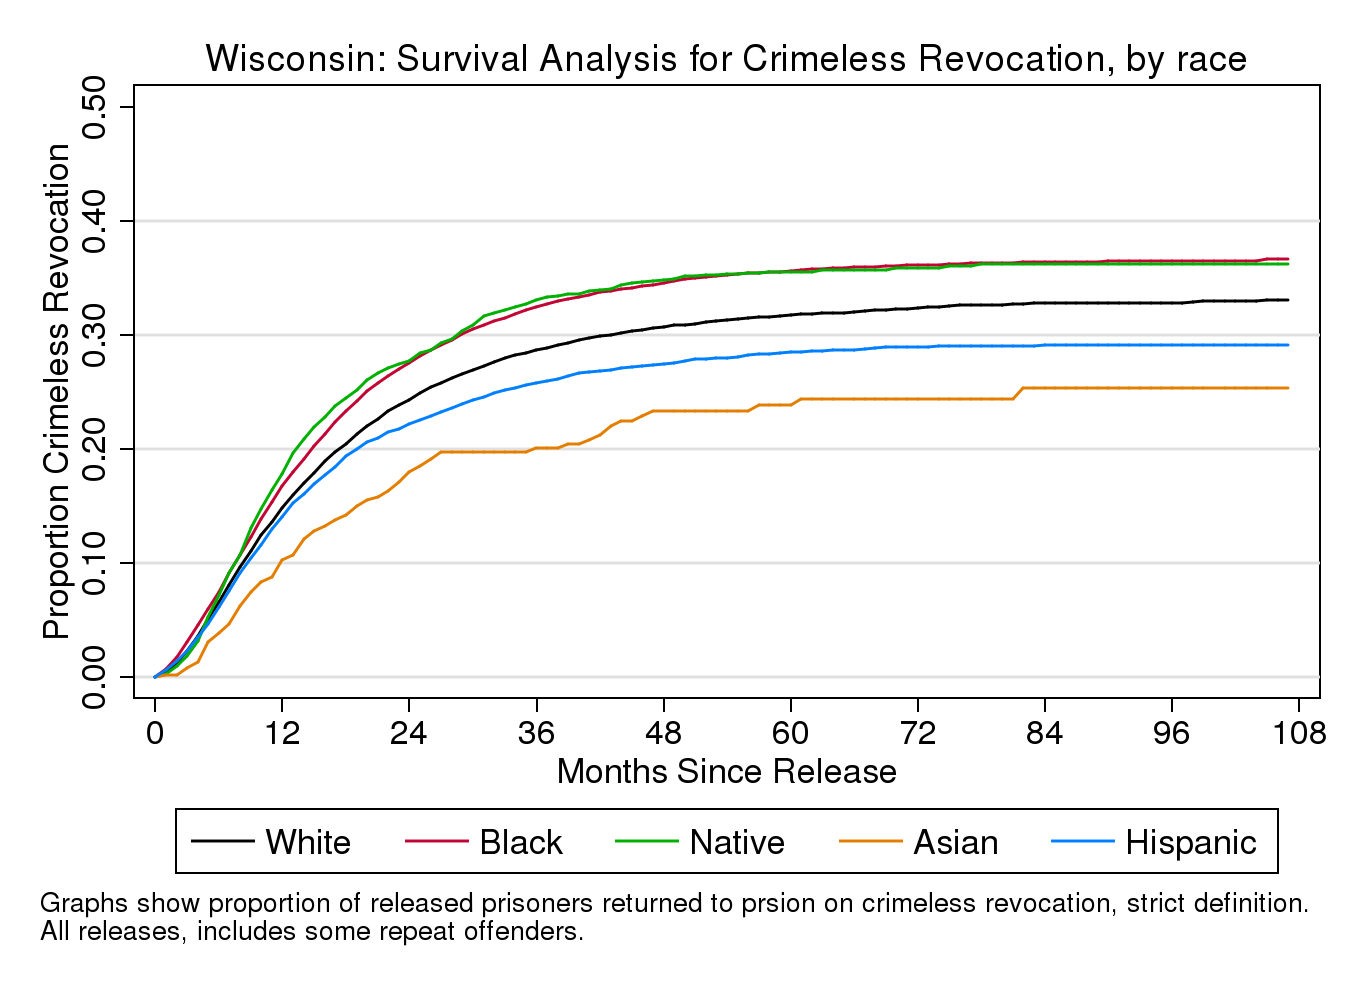
The graph for all releases counts some people multiple times, if they were released multiple times. To get a clearer picture of the patterns, we may separate first releases from later releases. Looking only at first releases, Native American Indians have the highest rates of crimeless revocations, then Blacks, then Whites, then Hispanics, then Asians. Native American Indians have about a 30% higher rate of crimeless revocations than Whites, and Blacks about 20% higher. (These are comparable to disparity ratios of 1.3 and 1.2). The Hispanic rate of crimeless revocation is about 80% that of the White rate. Crimeless revocations pretty much level out after 60 months (five years), but still can occur later for Blacks and Whites.

When we look at second and subsequent releases, there is no racial difference between Whites, Blacks and Hispanics in returns due to crimeless revocations. Asians and American Indians show somewhat lower rates, but their numbers are also small.
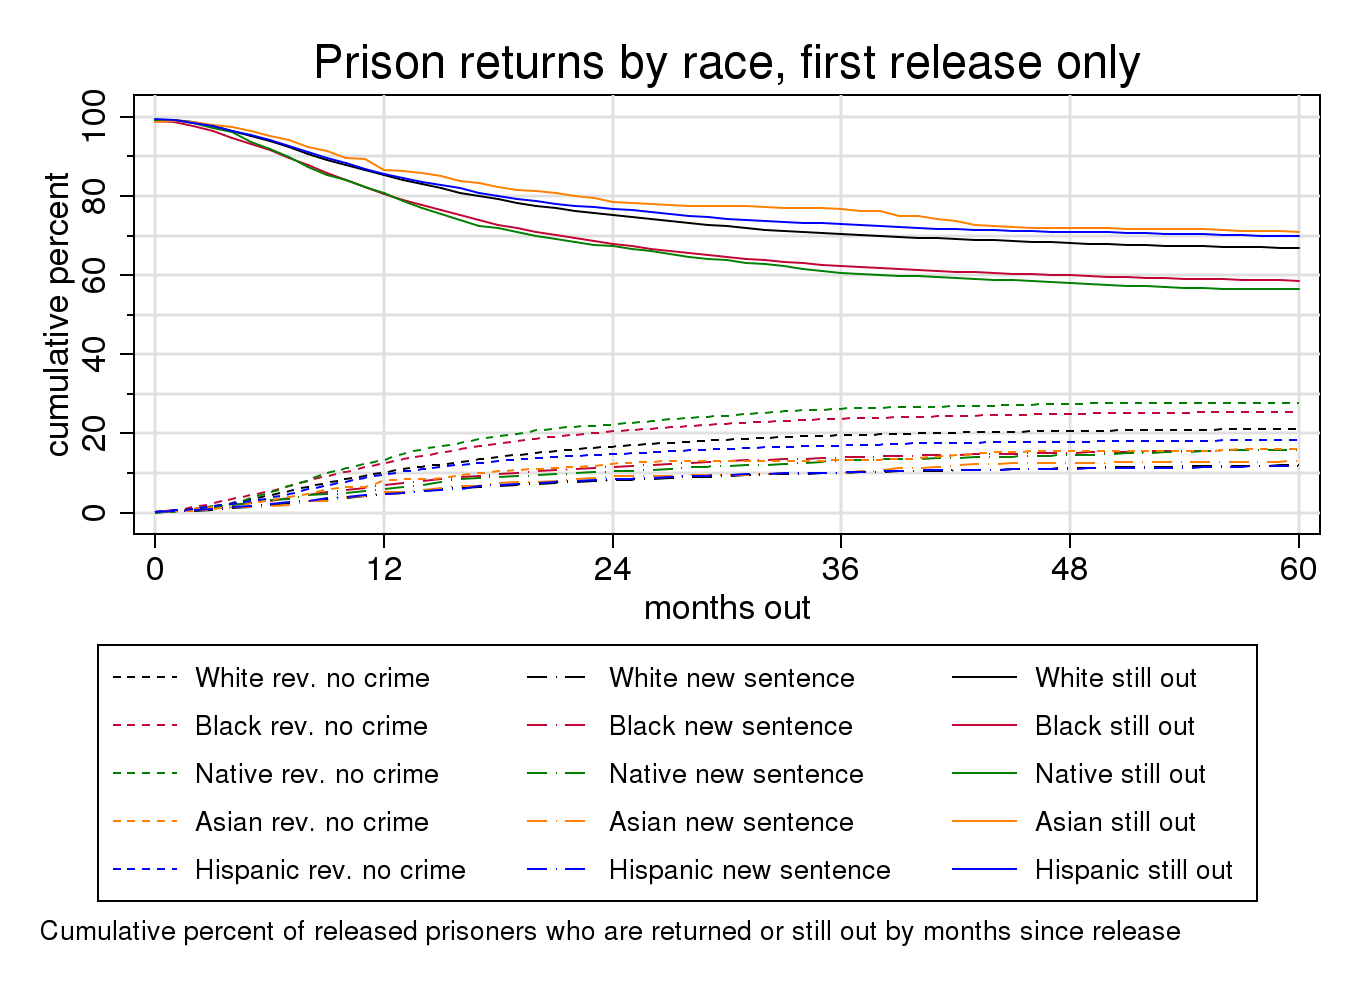
The risk of a crimeless revocation is affected by having had a non-crimeless revocation. To see the context of racial difference both crimeless revocations and other returns to prison, we may generate a more complex graph that charts all three states across months since release. The solid lines at the top track the declining percentage of each race that is still out of prison after a given number of months after the first release. Blacks and Native American Indians have the lowest rates of staying out, ending at just under 60% by year 5. Whites, Hispanics and Asians have higher rates of staying out, ending at about 70%. Looking at the lines for prison returns at the bottom, all races have much higher proportions–roughly double–returning to prison on crimeless revocations (strictly defined) than returns involving new offenses. The racial differences in returns due to new offenses are smaller, with some of the lines falling on each other: new sentence rates are higher for Natives and Blacks than for Whites and Hispanics, with Asians falling in the middle.
Older Information
I do not have any recent information about probation, but I do have some graphs I calculated from data provided by staff members of the Wisconsin Department of Corrections in 2007, when I was on the Governor’s Commission to Reduce Racial Disparities. These data use the broader “no new sentence” criterion for crimeless revocations.
The first graph shows the time trend in probation revocations with no new sentence. This is calculated by dividing the number admitted to prison on a probation revocation (with no new sentence) in a year by the number of people on probation that year. Notice that less than 5% of probationers of any race were revoked, but that percentage went up for all races during the 1990s.

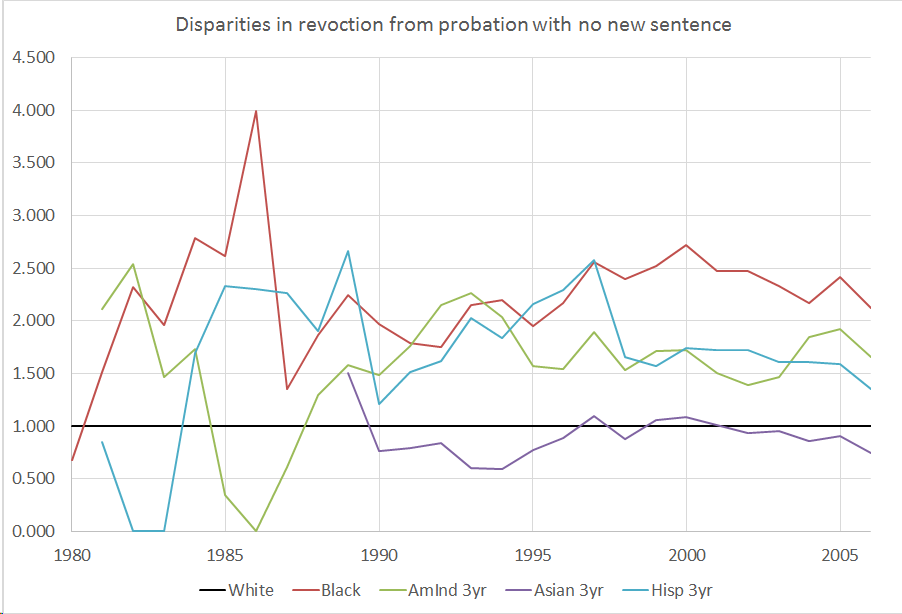
The next graph shows the minority/White disparity ratios for probation revocations with no new sentence for 1990 to 2006. Because of the small numbers of Asians, Hispanics and American Indians revoked, their disparity ratios are calculated based on 3-year averages. Data for Asians are suppressed before 1990 because of extremely small numbers. These ratios vary from year to year but show no clear time trend. The Black/White ratio in probation revocations ranged from 2 to 2.5, while the ratio for Hispanics and American Indians ranged from 1.5 to 2. The Asian revocation rate was comparable to the White rate.
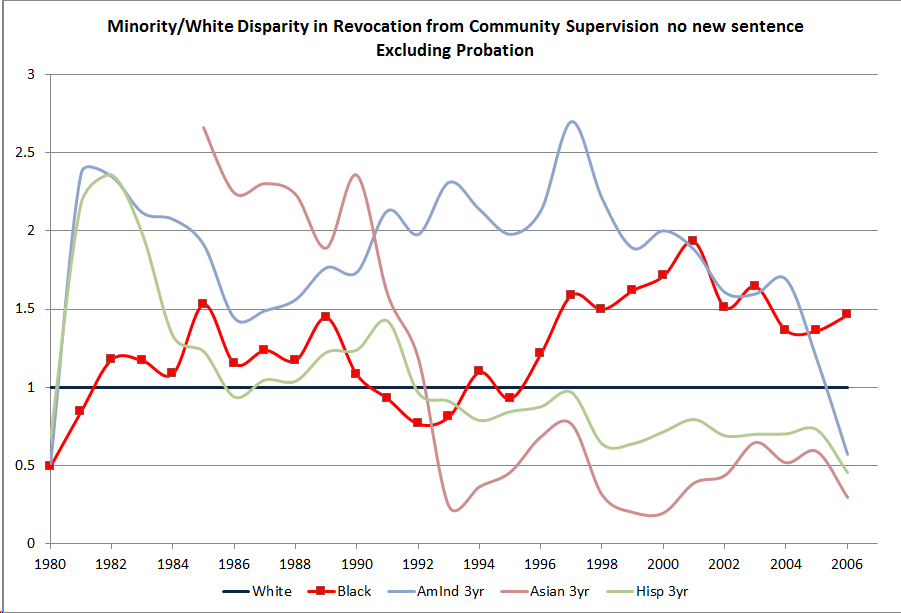
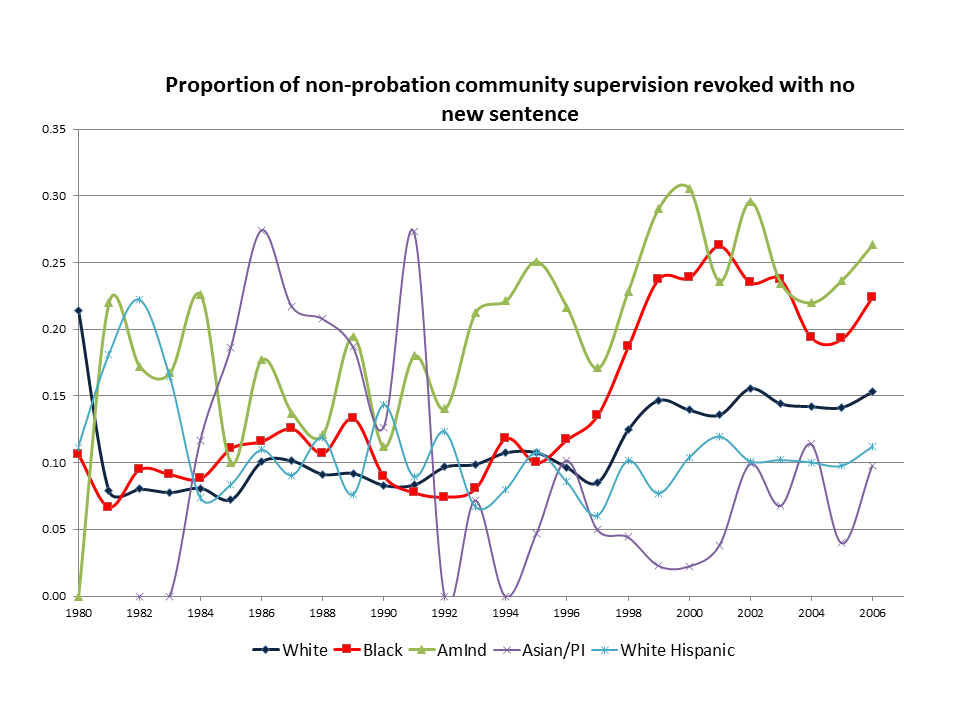
Here are the comparable graphs for post-prison supervision. The Asian and American Indian rates fluctuate widely due to small numbers. Eyeballing the graph, it looks like the Black revocation rates went up in the 1990s more than for other races.
The disparity ratios calculated from the above graph again fluctuate widely for smaller minorities, especially in the 1980s, so I re-calculated the disparity ratios for the smaller minority groups using three year averages to smooth them out. The Black/White disparity went up in the 1990s and was about 1.5 in the 2000s; the Native/White disparity was about 2 1990s and came down to 1.5 in the 2000s; disparity ratios for Asians and Hispanics were less than 1, i.e. a lower revocation rate than for Whites. Overall the patterns are similar to the more recent analysis, except that the Black and Native disparities may be lower. However, the survival rate approach to calculating the rate of return is a different methodology from dividing the number of revocations by the population.