
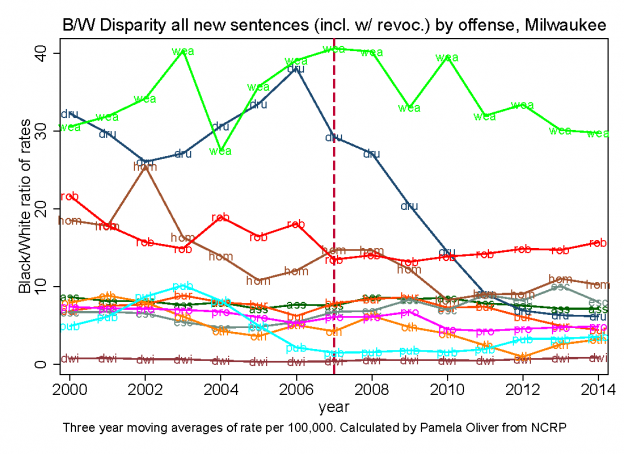
These graphs are calculated from the restricted files of the National Corrections Reporting Program. They show the rate of admissions to prison for new sentences by offense group separately for Blacks, Whites and the Black/White disparity. A chart for the offense codes is between the Black and White graphs. They show that the decline in Black sentences in Milwaukee was primarily for drug offenses and that DWI (driving white intoxicated) rose in importance as a source of White sentences. Methodological notes below. Click here to download the full report in PDF format
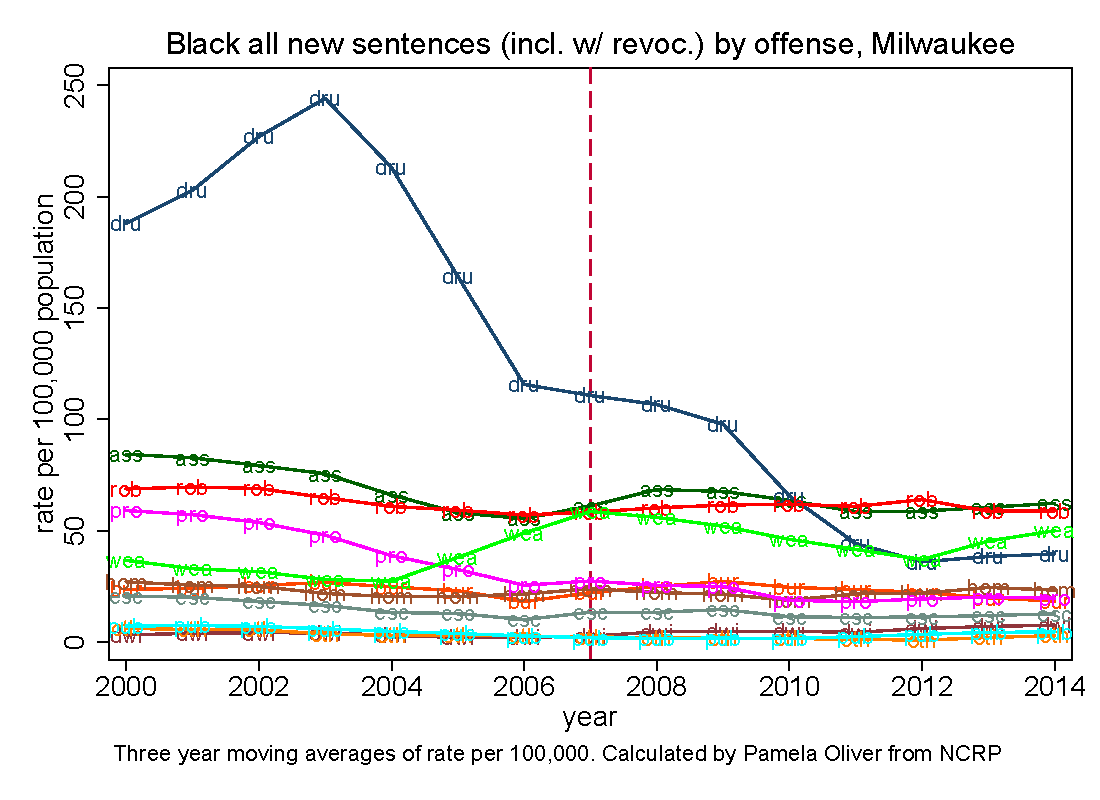
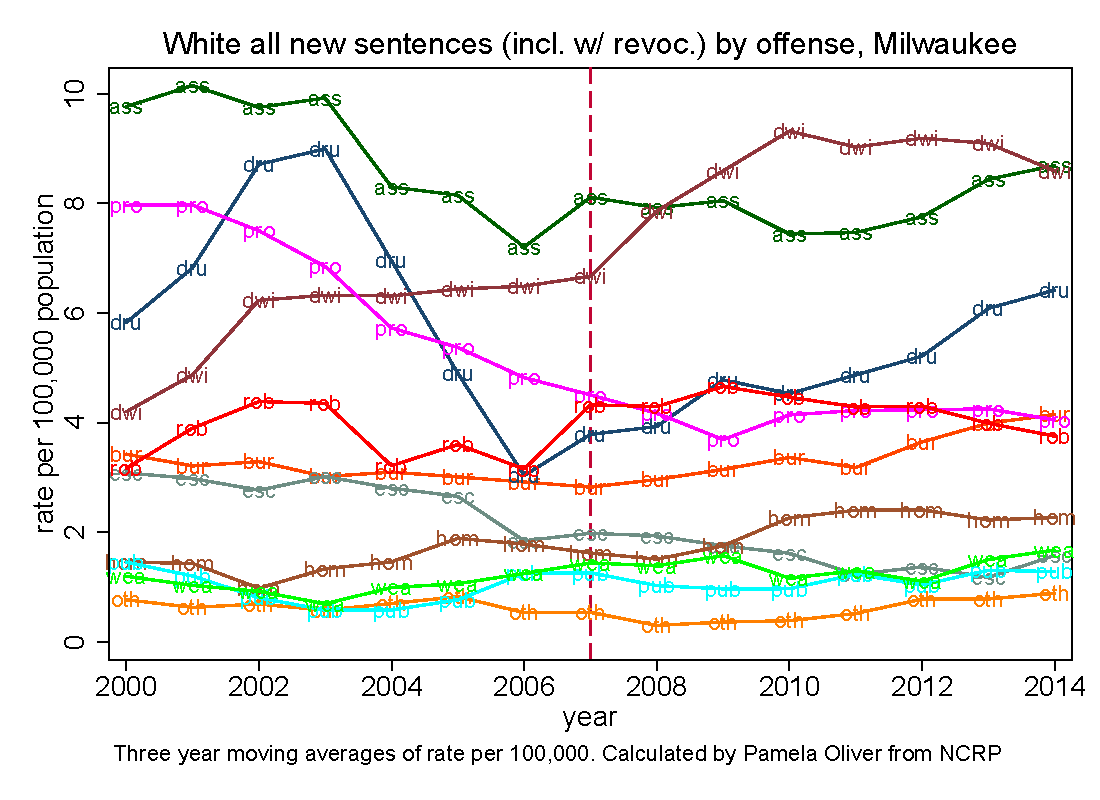
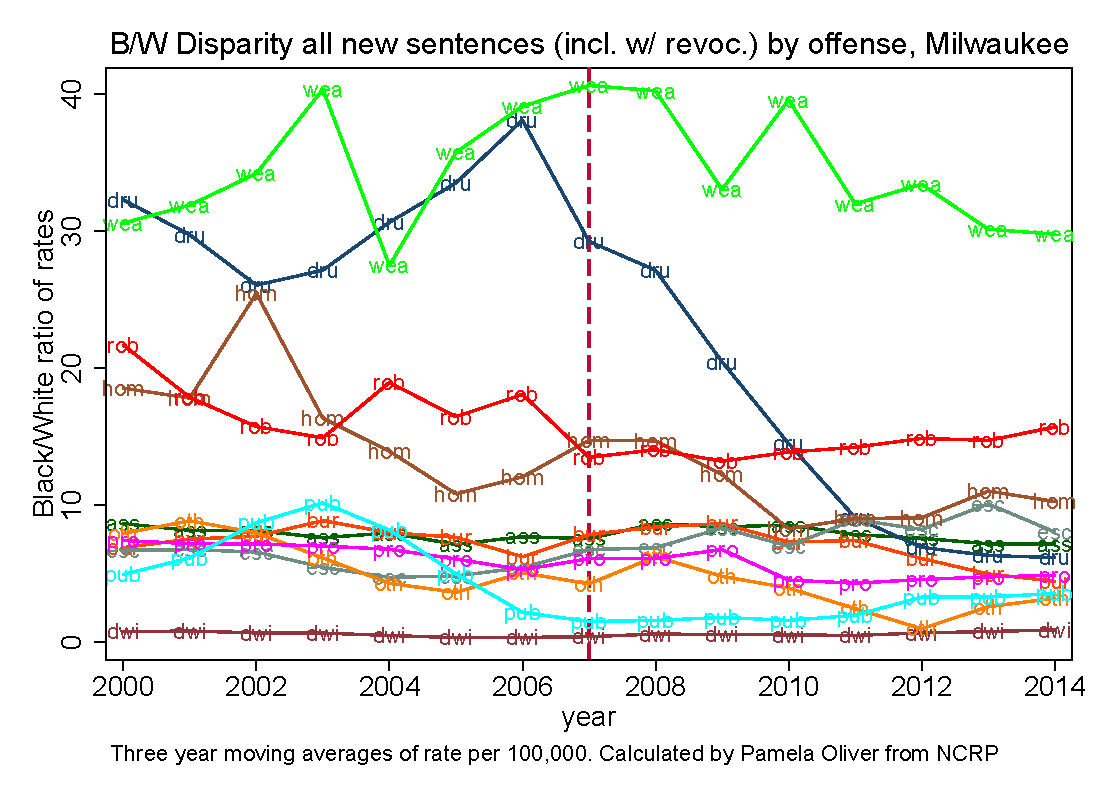
Notes on methods: (1) Data source is the restricted file of the National Corrections Reporting Program. (2) Rates are calculated using Census estimates of the population of all ages of a given race. (3) Three-year moving averages of numbers of prison admissions are used both to provide smoother graphs and meet data confidentiality requirements. (4) Black/White disparity is the ratio of the Black and White rates. It may be interpreted as the relative odds of being sentenced to prison for a given offense. (5) The offense is the one designated by the Bureau of Justice Statistics as the offense with the longest sentence attached; this may not be the most recent offense. (6) These graphs include all admissions designated in the file as involving a “new prison commitment,” including both new commitment only and a new commitment plus a revocation from probation or post-prison supervision (parole, mandatory release, extended supervision). (7) Hispanics, Asians, and American Indians are excluded from this report because their smaller numbers require a less detailed analysis.
Click here to download the full report in PDF format