I’ve written several posts trying to clarify the reasons you will get a different mix of offenders in a snapshot of who is in prison versus the flow of prison admissions. This also comes up as we compare the combination of offense type and admission type.
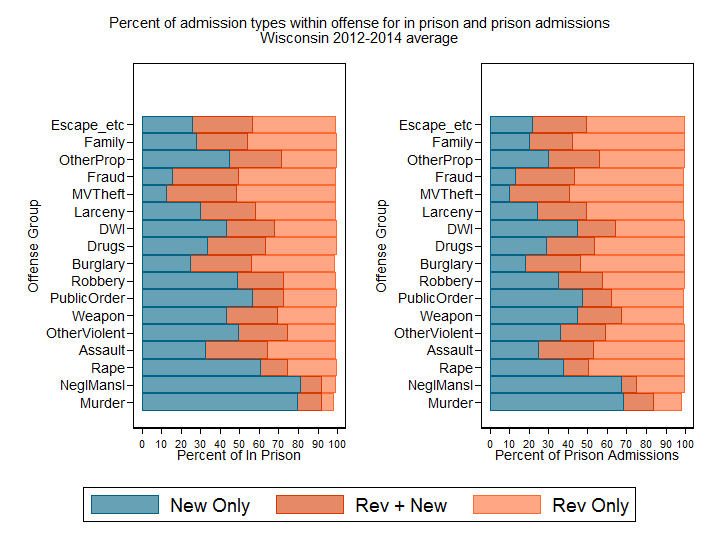
To illustrate this, I have taken the average proportion of people in prison or admitted to prison 2012 to 2014 who entered prison in each of the three basic admission categories: (1) “New Only” which means they were not under community supervision at the time they were sentenced, and have only a new conviction; (2) “Revocation + New” which means they were under community supervision and revoked into prison and also have a new offense, either because they are classified as “revocation plus new commitment” in the NCRP records or because I found a new offense in their record even though they had been admitted in the status “revocation, no new commitment.” (3) “Revocation Only” which means they were revoked into prison with no new commitment and I found no new offense in their record. The small number of other or unknown admission statuses are ignored, which is why the totals in the graphs are sometimes not quite equal to 1.
Across all offense groups, a higher proportion of people sitting in prison 2012-14 had been admitted on a new conviction than the proportion of new convictions among all prison admissions in that same period. Across all offenses, prison admissions consistently have a higher proportion of people entering on revocations with no new sentence than the proportion sitting in prison whose admission status was a revocation with no new sentence. This is because prison stays after revocation tend to be shorter than the initial stays on a new commitment.

This difference is especially pronounced for rape, where about 60% of the people sitting in prison for rape 2012-14 were serving their initial sentence having entered on a new conviction, while a majority of the people entering prison whose offense was rape were entering on a “crimeless” revocation with no new conviction and only 40% were entering on a new conviction.
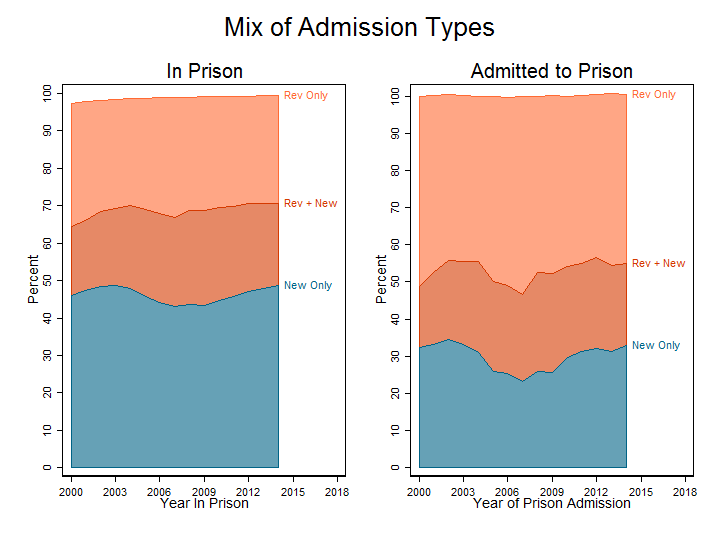
You get a similar pattern if you combine all offenses and look at the trends over time. Roughly half of the people in prison in a given year originally entered on a new conviction, while only about a third of the people admitted to prison in a given year are entering on a new conviction. At the other end, nearly half of the people admitted to prison in a given year enter on a crimeless revocation with no new offense (as strictly defined), while only about 30% of the people sitting in prison in a given year originally entered on a crimeless revocation. As the graph shows, these proportions fluctuated somewhat over time, with the proportion of new commitments going down 2004-9 and then coming back up to prior levels by 2012. The fluctuation was greater for admissions than for those in prison.
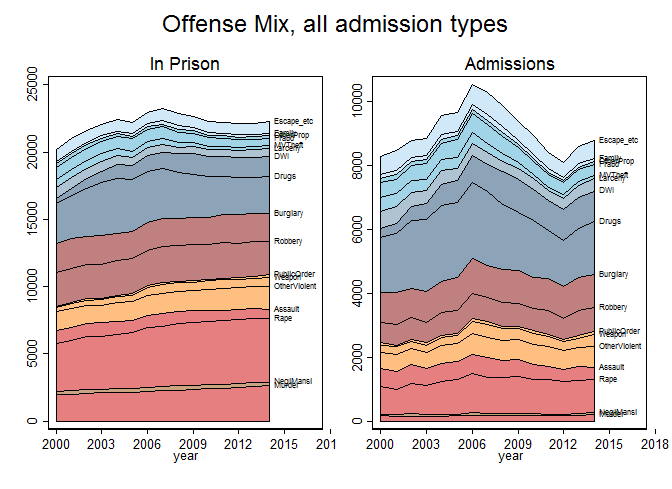
This leads to a different mixture of offenses in the population of people who are in prison vs. those who enter prison. You can see that violent offenses (especially murder and rape) are more common among those in prison, while drug offenses and DWI are more common among those admitted to prison.