8 Exercises
8.1 Working Backwards
These exercises require the materials from chapters 1-5.
Reproduce these plots with the specified datasets.
Use
mtcars.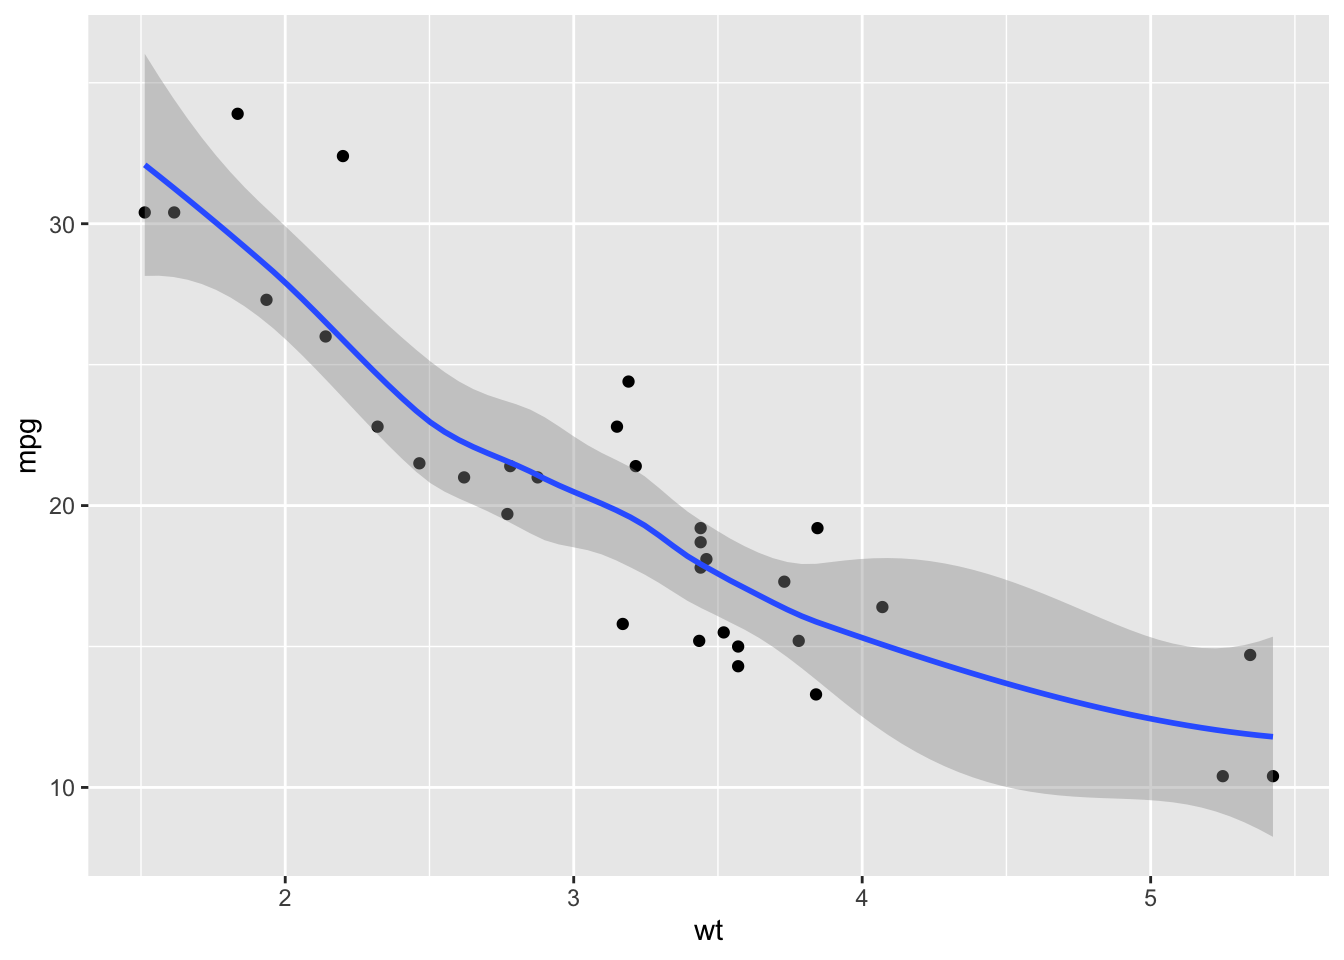
Use
mtcars.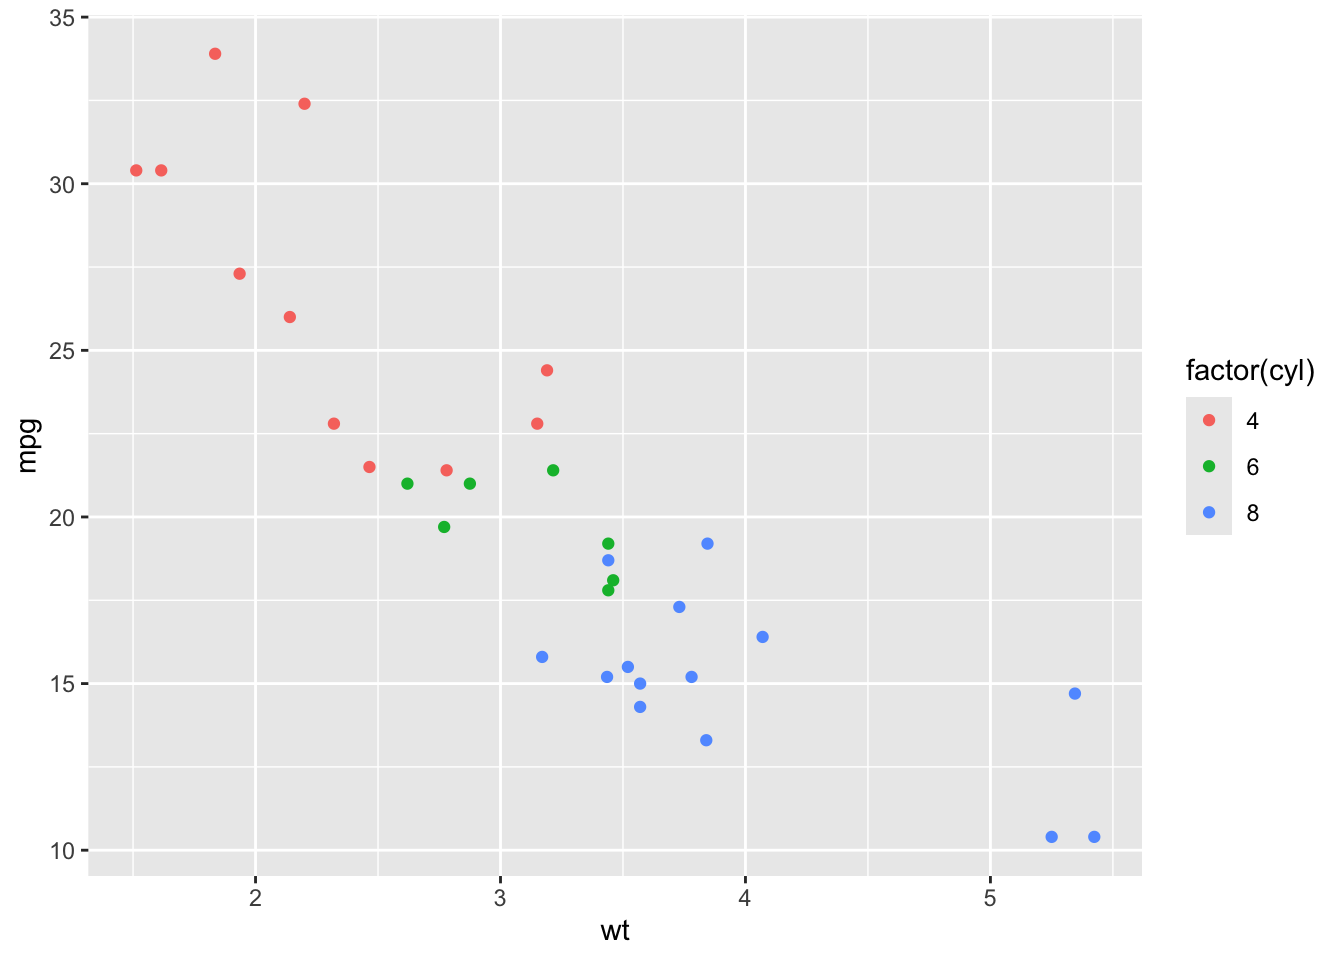
Use
airquality.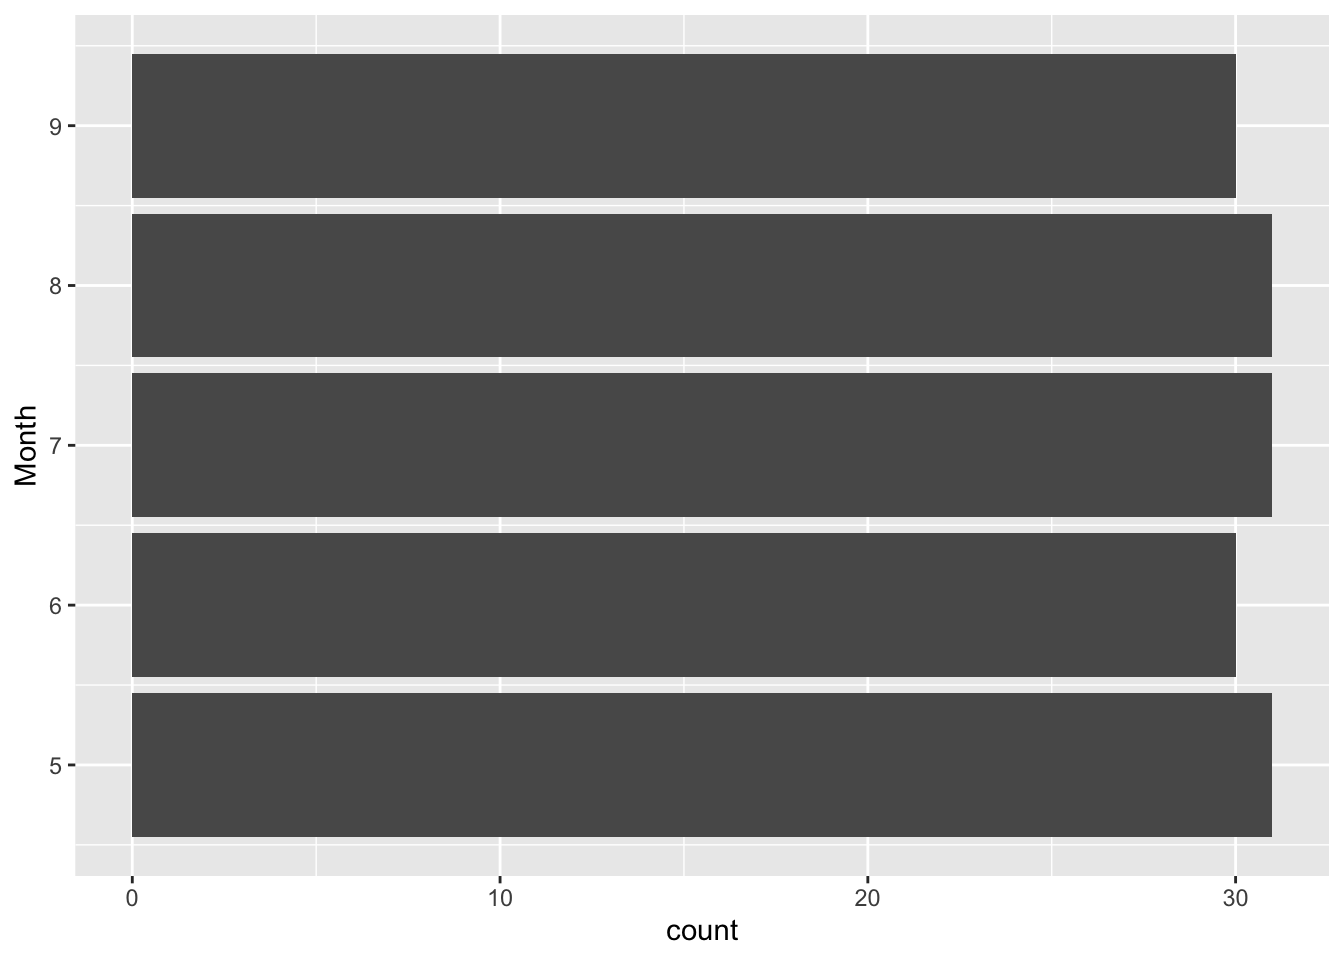
Use
airquality.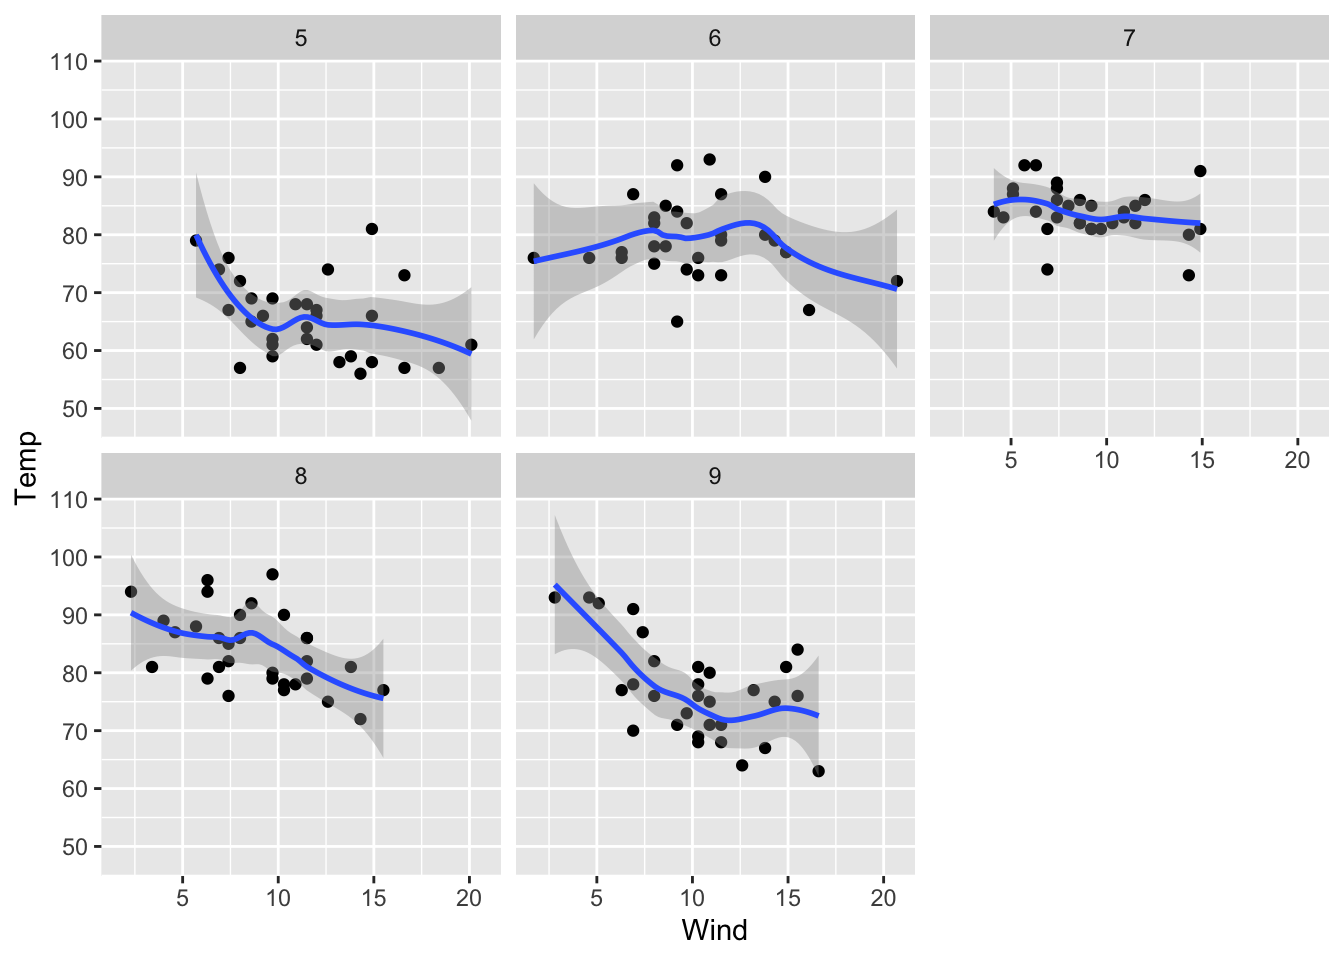
8.2 The Plotting Workflow
These exercises require the materials from chapters 1-7.
Pick either one of these datasets from ggplot2:
midwest, data on Midwest counties from the 2000 Censusdiamonds, attributes of diamonds
Use this dataset for the following exercises:
Create a plot of…
counts by a discrete variable.
a histogram or density of a continuous variable.
a summary statistic (mean, median, minimum, maximum, etc.) of a continuous variable for each value of a discrete variable.
a scatterplot of two continuous variables, with a smoothed conditional mean line.
three variables.
Using one of the plots you created for exercise 1, …
change the title and axis labels.
change the theme, either manually or with a preset.
save it as an image file.