 Supporting Statistical Analysis for Research
5.6 Related observations
These exercises use the mtcars.csv data set.
Import the
mtcars.csvdata set.mtcars_path <- file.path("..", "datasets", "mtcars.csv") mtcars_in <- read_csv(mtcars_path, col_types = cols())Warning: Missing column names filled in: 'X1' [1]mtcars_in <- rename(mtcars_in, make_model = X1) mtcars <- mtcars_in glimpse(mtcars)Observations: 32 Variables: 12 $ make_model <chr> "Mazda RX4", "Mazda RX4 Wag", "Datsun 710", "Hornet... $ mpg <dbl> 21.0, 21.0, 22.8, 21.4, 18.7, 18.1, 14.3, 24.4, 22.... $ cyl <dbl> 6, 6, 4, 6, 8, 6, 8, 4, 4, 6, 6, 8, 8, 8, 8, 8, 8, ... $ disp <dbl> 160.0, 160.0, 108.0, 258.0, 360.0, 225.0, 360.0, 14... $ hp <dbl> 110, 110, 93, 110, 175, 105, 245, 62, 95, 123, 123,... $ drat <dbl> 3.90, 3.90, 3.85, 3.08, 3.15, 2.76, 3.21, 3.69, 3.9... $ wt <dbl> 2.620, 2.875, 2.320, 3.215, 3.440, 3.460, 3.570, 3.... $ qsec <dbl> 16.46, 17.02, 18.61, 19.44, 17.02, 20.22, 15.84, 20... $ vs <dbl> 0, 0, 1, 1, 0, 1, 0, 1, 1, 1, 1, 0, 0, 0, 0, 0, 0, ... $ am <dbl> 1, 1, 1, 0, 0, 0, 0, 0, 0, 0, 0, 0, 0, 0, 0, 0, 0, ... $ gear <dbl> 4, 4, 4, 3, 3, 3, 3, 4, 4, 4, 4, 3, 3, 3, 3, 3, 3, ... $ carb <dbl> 4, 4, 1, 1, 2, 1, 4, 2, 2, 4, 4, 3, 3, 3, 4, 4, 4, ...Find the most efficient car (mpg) for each number of cylinders.
best_mpg_cyl <-
  mtcars %>%
  group_by(cyl) %>%
  mutate(
    mpg_rank = rank(desc(mpg))
  ) %>%
  ungroup()

best_mpg_cyl %>%
  filter(mpg_rank == 1) %>%
  select(make_model, cyl, mpg, disp) %>%
  head()
# A tibble: 3 x 4 make_model cyl mpg disp <chr> <dbl> <dbl> <dbl> 1 Hornet 4 Drive 6 21.4 258 2 Toyota Corolla 4 33.9 71.1 3 Pontiac Firebird 8 19.2 400The weight of a car is a major contributor to how efficient it is. Create a variable that measures mpg per unit of weight. Plot this new variable against
hpand thendisp, These plots should consider the relationship with the number of cylinders. From these plots, doeshpordispseem to be more related to the new variable when considering the number of cylinders?mtcars <- mtcars %>% mutate( mpg_per_wt = mpg / wt ) mtcars %>% select(make_model, wt, mpg, mpg_per_wt) %>% head()# A tibble: 6 x 4 make_model wt mpg mpg_per_wt <chr> <dbl> <dbl> <dbl> 1 Mazda RX4 2.62 21 8.02 2 Mazda RX4 Wag 2.88 21 7.30 3 Datsun 710 2.32 22.8 9.83 4 Hornet 4 Drive 3.22 21.4 6.66 5 Hornet Sportabout 3.44 18.7 5.44 6 Valiant 3.46 18.1 5.23ggplot(mtcars, aes(x = disp, y = mpg_per_wt)) + geom_point() + facet_wrap(~cyl) + theme_bw()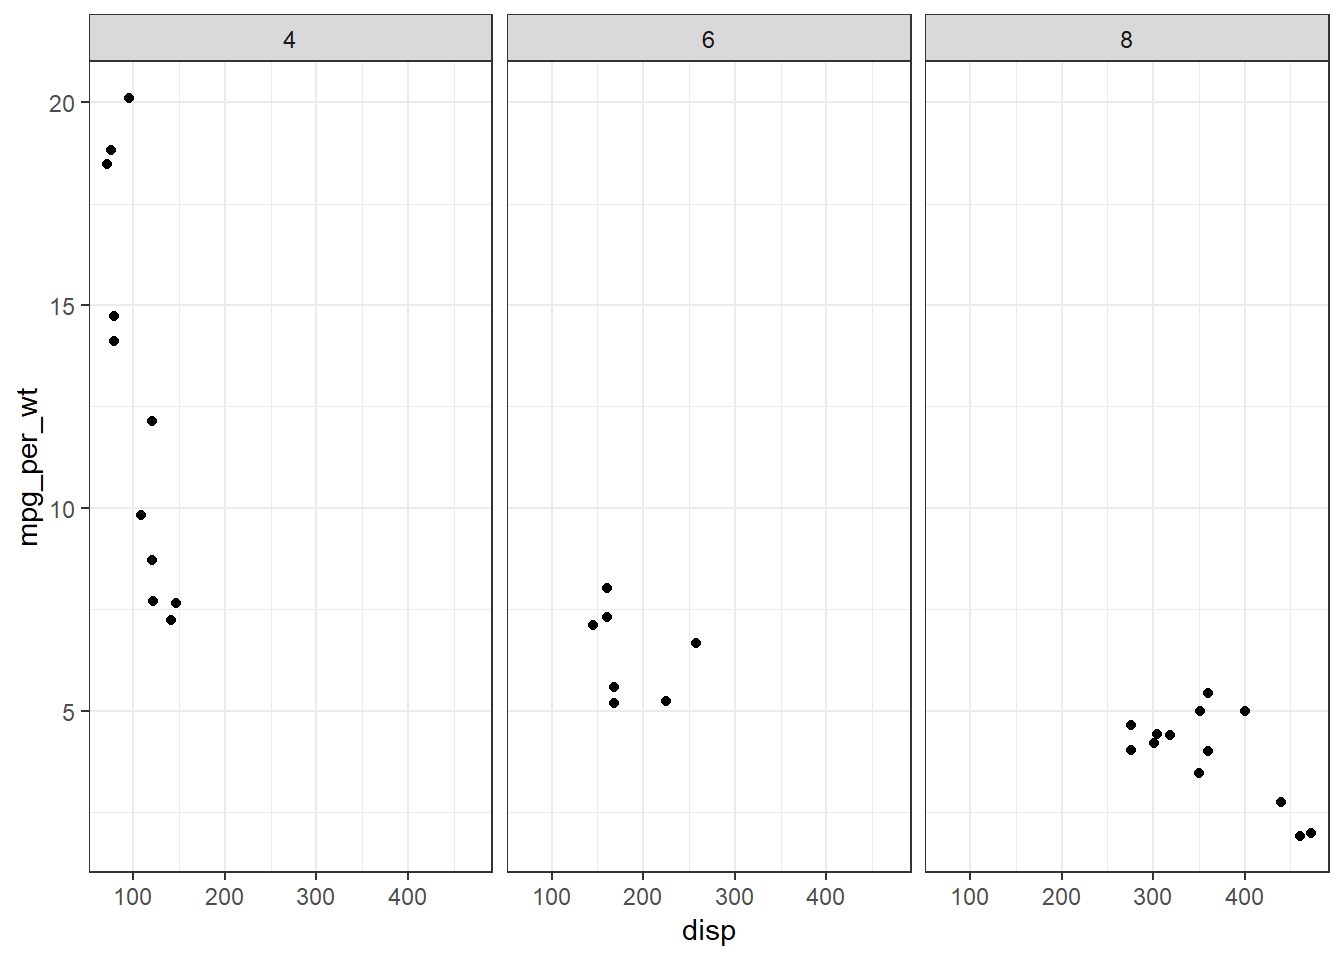
ggplot(mtcars, aes(x = hp, y = mpg_per_wt)) +
  geom_point() +
  facet_wrap(~cyl) +
  theme_bw()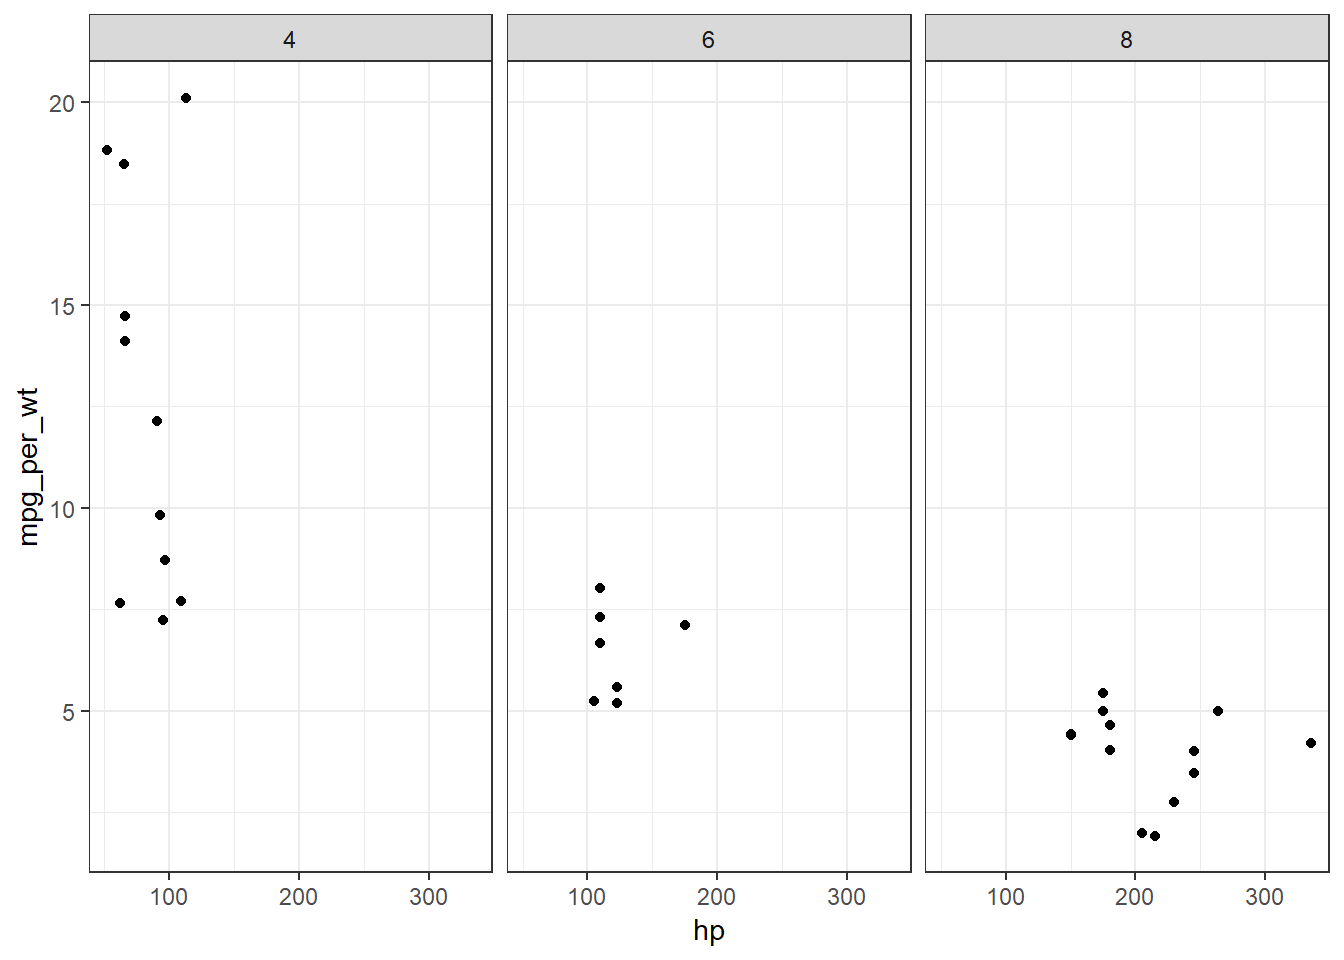
Both
hpanddispseem to be related tompg_per_wt. Thedispvariable seems to have a stronger relationship withmpg_per_wt.Find the least efficient car (using the new variable that considers both mpg and weight) for each number of cylinders and gear combination. Exclude any combination that does not have at least two observations.
eff_cyl_gear <-
  mtcars %>%
  group_by(cyl, gear) %>%
  mutate(
    num_group_obs = n(),
    efficiency_rank = rank(mpg_per_wt)
  ) %>%
  filter(
    num_group_obs >= 2,
    efficiency_rank == 1
  ) %>%
  ungroup()

eff_cyl_gear %>%
  select(make_model, cyl, gear, mpg_per_wt, mpg, disp) %>%
  arrange(cyl, gear, mpg_per_wt) %>%
  head()
# A tibble: 6 x 6 make_model cyl gear mpg_per_wt mpg disp <chr> <dbl> <dbl> <dbl> <dbl> <dbl> 1 Merc 230 4 4 7.24 22.8 141. 2 Porsche 914-2 4 5 12.1 26 120. 3 Valiant 6 3 5.23 18.1 225 4 Merc 280C 6 4 5.17 17.8 168. 5 Lincoln Continental 8 3 1.92 10.4 460 6 Maserati Bora 8 5 4.20 15 301