A number of demographic methods were employed to adjust the data for relative completeness of death counts and adult age misstatement. The adjustment procedures were chosen from a battery of 10-12 techniques that proved to be optimal (in the sense of mean squared error reduction) in extensive simulations that reproduced known and suspected sources of errors in the data.
These adjustments are applied consistently across countries and years of observation. The resulting life tables are optimized for intertemporal and intercountry comparability. For adjustment procedures followed to construct life tables, see documentation.
The figures shown here plot multiple estimates of life expectancy at birth for 18 of the 19 countries in LAMBdA (Bolivia is excluded) and for a period of time that starts with the first available population census. The figures include not only estimates produced by the team that created LAMBdA but also alternative estimates and associated bounds of uncertainty computed independently for each country and year of observation. In future releases of the data the bounds of uncertainty will be computed using techniques that allow dependency across time periods and geographically or culturally similar countries.
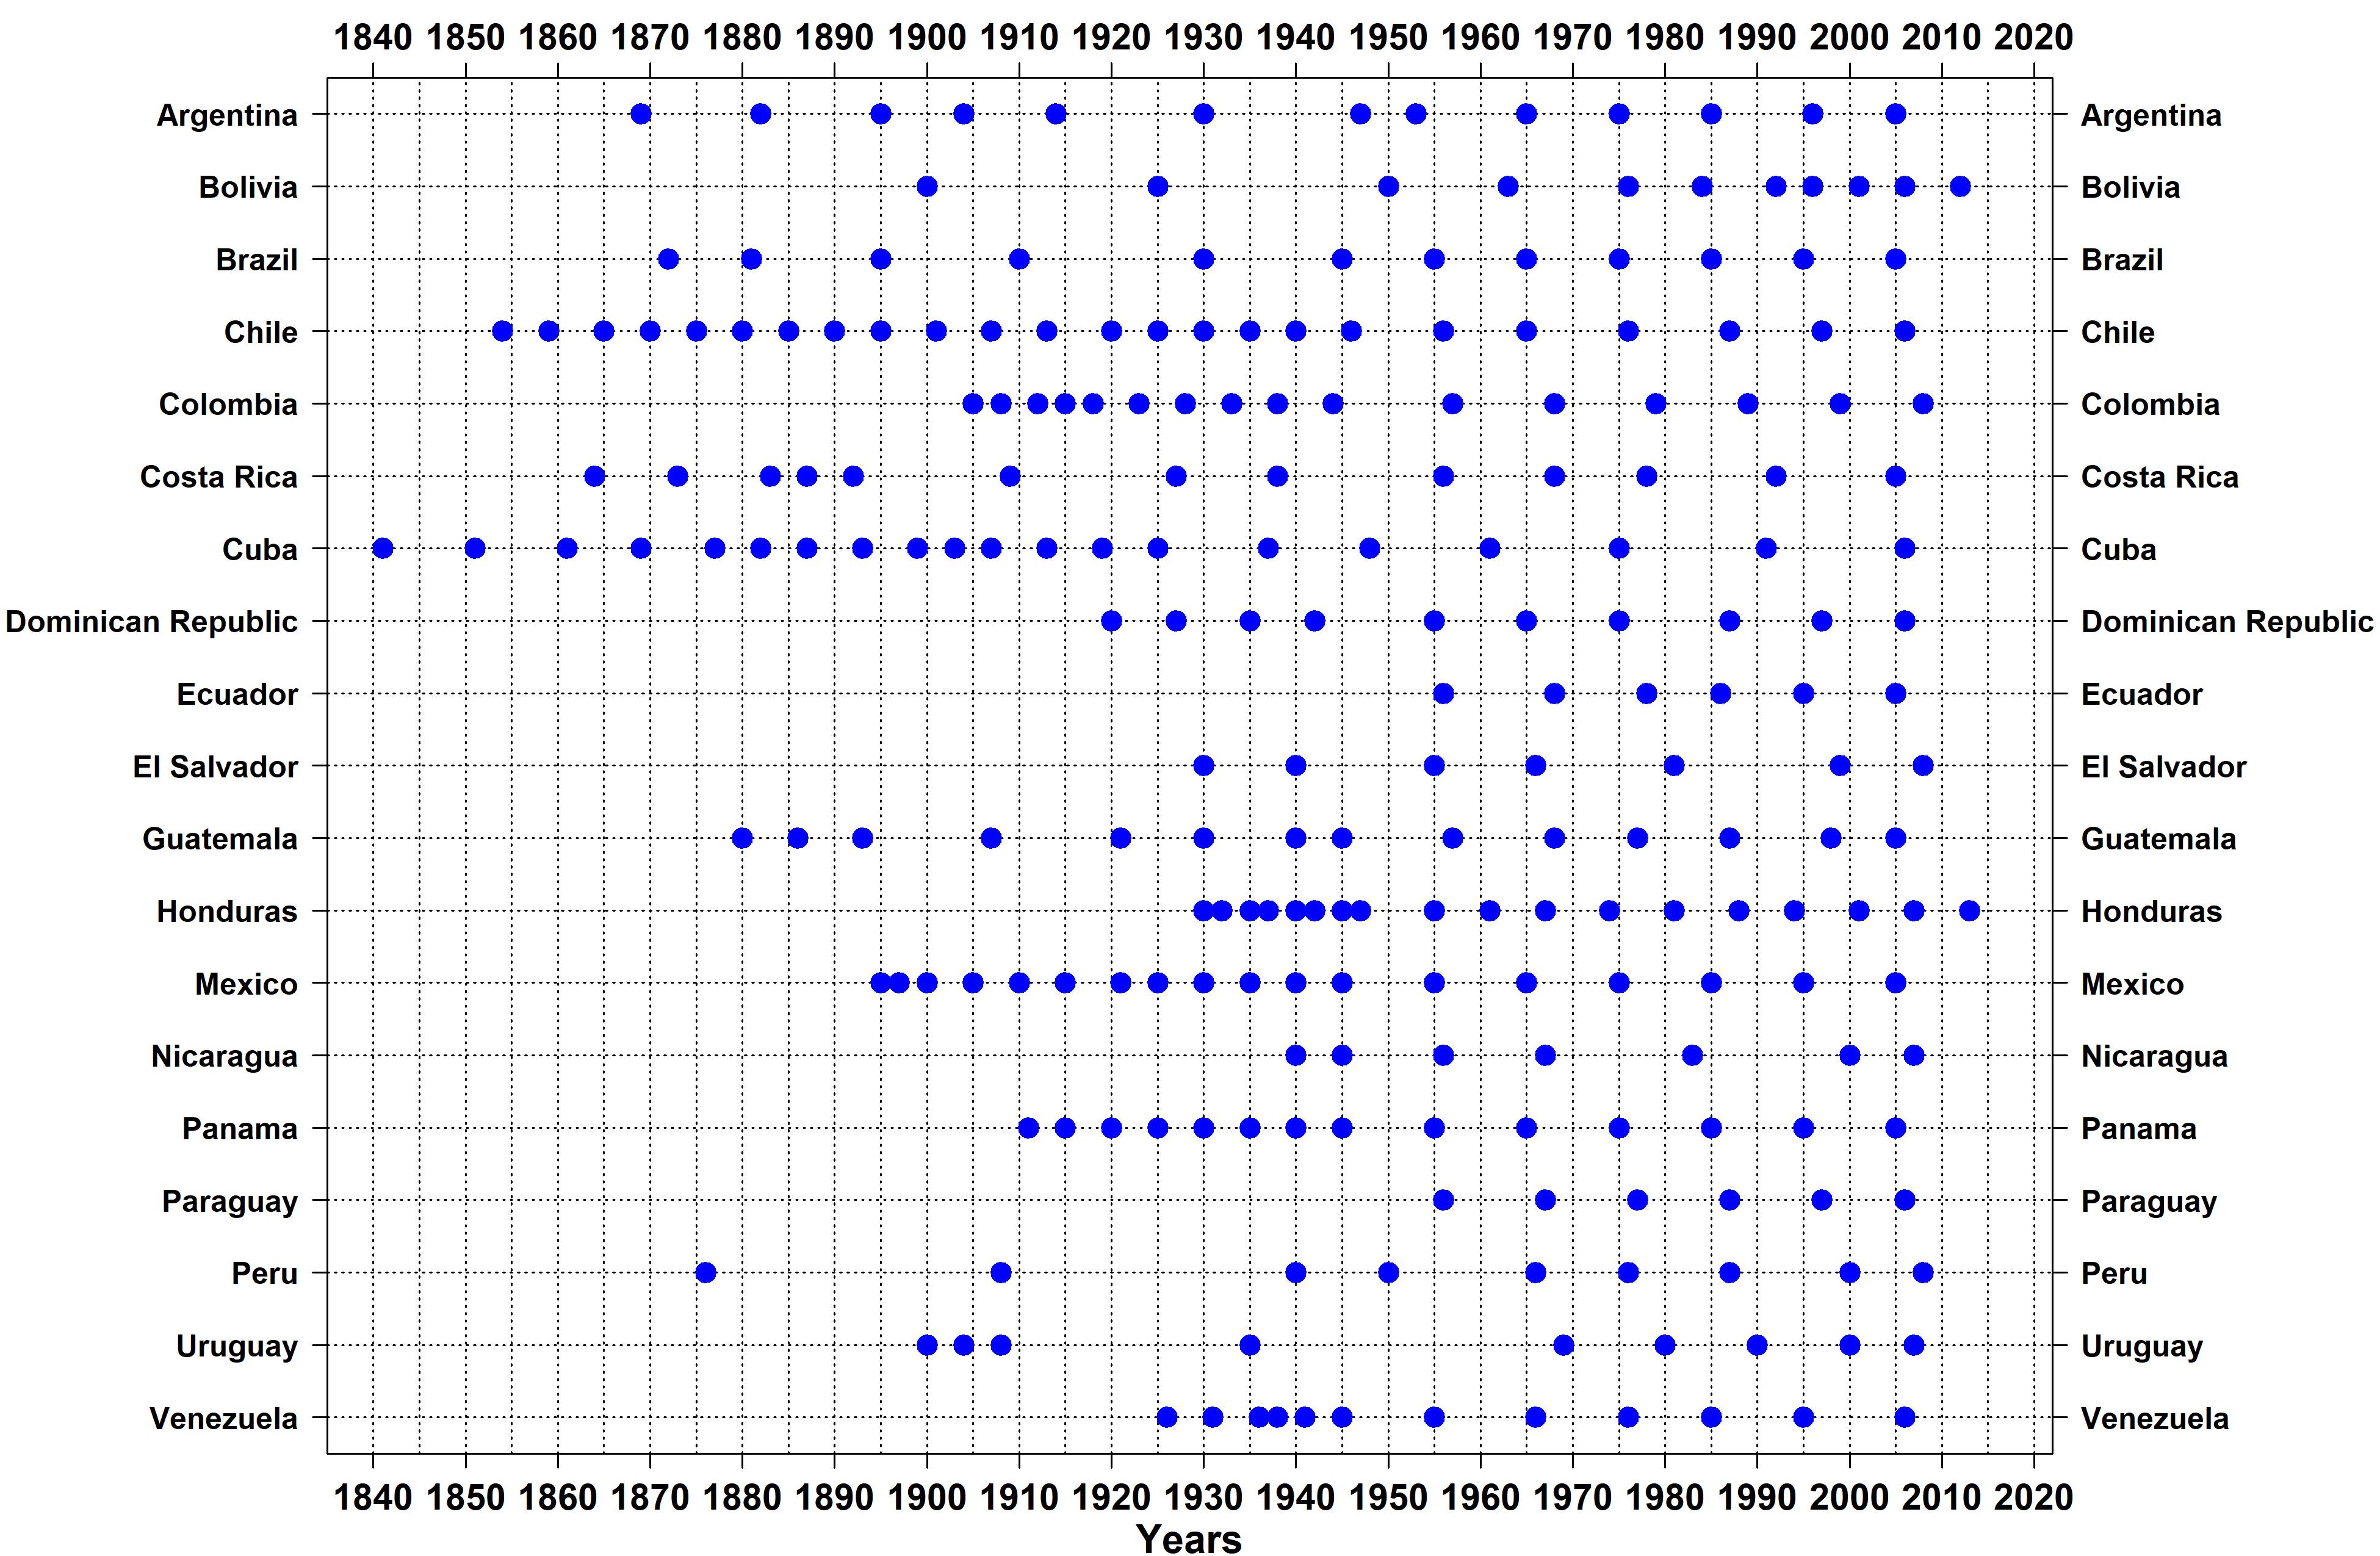
The diagram below shows PIVOTAL Life Tables available by country and year. These tables were constructed using several methods (see documentation).
- Adjusted PIVOTAL abridged life tables (five-year age groups) regardless of method used to generate them. Click here to access the data.
- Adjusted PIVOTAL single year of age life tables regardless of method used to generate them. Click here to access the data.
- Adjusted ANNUAL life tables for single years of age starting in 1950. Note that these tables were constructed using inter-pivotal correction factors. Click here to access the data.