3 Sample Statistics
3.1 Descriptive Stats
3.1.1 Analysis Type Basic
Perhaps the simplest analysis you can do using MPlus is to ask for descriptive statistics for your data. For example, using the ex3.1.dat data file. (Note example 3.1 as written in the User's Guide does not work with the example file!)
title: Basic stats
data:  file=ex3.1.dat;
variable: names= x1 x2 x3
analysis:  type=basic
A note on syntax: MPlus commands begin with a keyword and colon, and may include one or more subcommands, or options. These options are terminated with the semi- colon. Although we did not do this above, it is perhaps easiest to just habitually end every command and option with a semi-colon.
Comments are preceeded by an exclamation point.
Output can include a lot of information. Here is just part of the output from the commands above.
RESULTS FOR BASIC ANALYSIS

     SAMPLE STATISTICS

           Means
              X1            X2            X3
              ________      ________      ________
      1         0.485         0.001        -0.042

           Covariances
              X1            X2            X3
              ________      ________      ________
 X1             2.408
 X2             1.078         1.094
 X3             0.648         0.028         0.957

           Correlations
              X1            X2            X3
              ________      ________      ________
 X1             1.000
 X2             0.665         1.000
 X3             0.427         0.028         1.000

UNIVARIATE HIGHER-ORDER MOMENT DESCRIPTIVE STATISTICS

         Variable/         Mean/     Skewness/   Minimum/ % with                Percentiles
        Sample Size      Variance    Kurtosis    Maximum  Min/Max      20%/60%    40%/80%    Median
     X1                    0.485      -0.012      -4.116    0.20%      -0.768      0.070      0.429
             500.000       2.408      -0.136       5.111    0.20%       0.777      1.894
     X2                    0.001      -0.133      -3.145    0.20%      -0.922     -0.235      0.023
             500.000       1.094      -0.162       2.920    0.20%       0.304      0.876
     X3                   -0.042      -0.057      -3.139    0.20%      -0.921     -0.353     -0.040
             500.000       0.957      -0.357       2.875    0.20%       0.274      0.859
3.1.2 Means and Variances Model
Remarkably, there is an even simpler set of commands you could submit. You do not need a title: command, and there is actually a default analysis:. Try
! The simplest MPlus command file
data: file=ex3.1.dat;
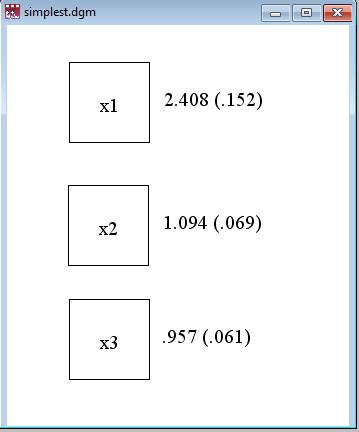
variable: names= x1 x2 x3Looking at the output below, you should recognize that this is a structural equations model in which all the variables are observed (sometimes called a path model), and in which there are no regression relations or correlations among the observed variables. Therefore this model has fit statistics, and standard errors of each estimated parameter.
A portion of the output is:
MODEL RESULTS
                                                    Two-Tailed
                    Estimate       S.E.  Est./S.E.    P-Value
 Means
    X1                 0.485      0.069      6.987      0.000
    X2                 0.001      0.047      0.028      0.978
    X3                -0.042      0.044     -0.964      0.335
 Variances
    X1                 2.408      0.152     15.811      0.000
    X2                 1.094      0.069     15.811      0.000
    X3                 0.957      0.061     15.811      0.000
and MPlus produces an accompanying diagram. Immediately after obtaining output, you can use <Alt-D> to see the model diagram, including the estimated variances.
3.1.3 Descriptive Statistics with Models
Since we are on the topic of descriptive sample statistics, it is worth pointing out that you can obtain them with any modeling command, just by specifying the sampstat option on the output: command.
title: Sample stat output
data:  file=ex3.1.dat;
variable: names= x1 x2 x3;
model:
    x1 on x2 x3;
output: sampstat
produces results from the type=basic analysis, as well as the model results.