 Supporting Statistical Analysis for Research
3.4 Relationship between more than two variables
These exercises use the Mroz.csv data set
that was imported in the prior section.
Import the
Mroz.csvdata set.from pathlib import Path import pandas as pd import plotnine as p9mroz_path = Path('..') / 'datasets' / 'Mroz.csv' mroz = pd.read_csv(mroz_path) print(mroz.dtypes)Unnamed: 0 int64 lfp object k5 int64 k618 int64 age int64 wc object hc object lwg float64 inc float64 dtype: objectCreate a scatter plot for
ageagainstlwg. Use color to display women college attendance status.print( p9.ggplot(mroz, p9.aes(x='age', y='lwg', color='wc')) + p9.geom_point() + p9.theme_bw())<ggplot: (143590174868)>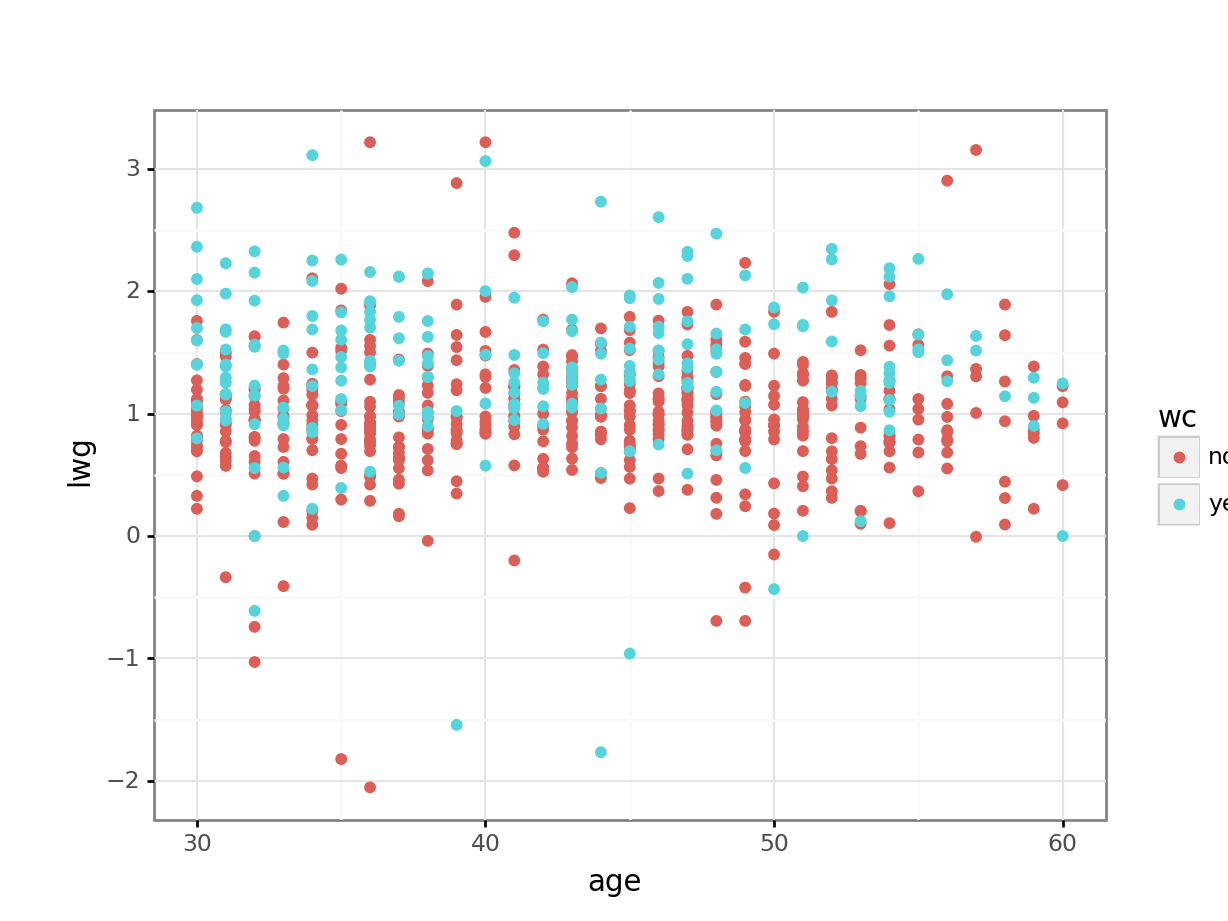
Facet the prior plot on
hc.print( p9.ggplot(mroz, p9.aes(x='age', y='lwg', color='wc')) + p9.geom_point() + p9.facet_wrap('~hc') + p9.theme_bw())<ggplot: (143590151239)>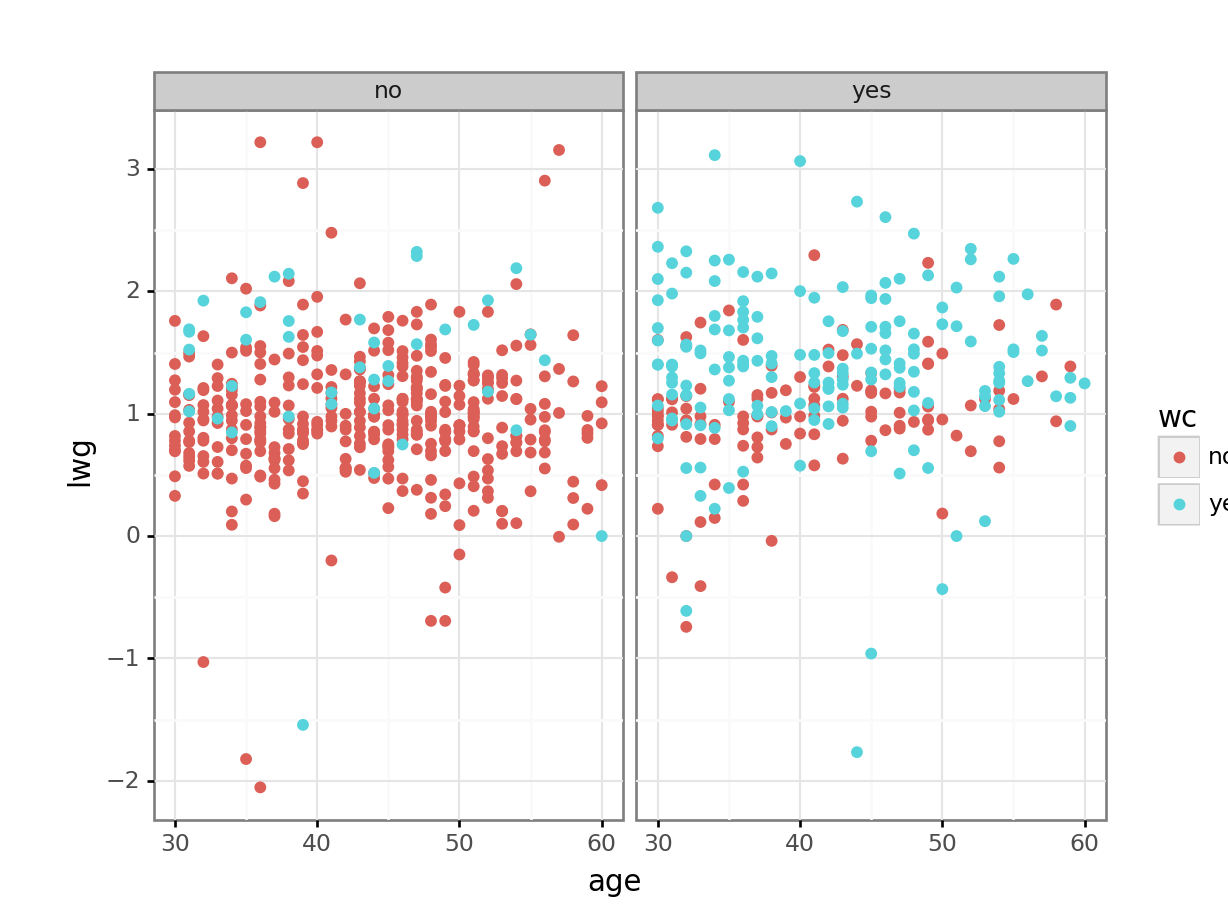
Add a loess smoothing line
hc.print( p9.ggplot(mroz, p9.aes(x='age', y='lwg', color='wc')) + p9.geom_point() + p9.geom_smooth(color='blue') + p9.facet_wrap('~hc') + p9.theme_bw())<ggplot: (143590949661)> C:\PROGRA~3\ANACON~1\lib\site-packages\plotnine\stats\smoothers.py:146: UserWarning: Confidence intervals are not yet implementedfor lowess smoothings. warnings.warn("Confidence intervals are not yet implemented" C:\PROGRA~3\ANACON~1\lib\site-packages\plotnine\stats\smoothers.py:146: UserWarning: Confidence intervals are not yet implementedfor lowess smoothings. warnings.warn("Confidence intervals are not yet implemented"
If the prior plot produces a message or warning, change the code to avoid the warning.
The plotnine package does not support confidence intervals. These need to be turned off. The
separameter is difficult to find. If you google "plotnine stat_smooth", you will find a page for thisstat_smooth()method. The parameter is documented there.print( p9.ggplot(mroz, p9.aes(x='age', y='lwg', color='wc')) + p9.geom_point() + p9.geom_smooth( se=False, color='blue') + p9.facet_wrap('~hc') + p9.theme_bw())<ggplot: (143590968696)>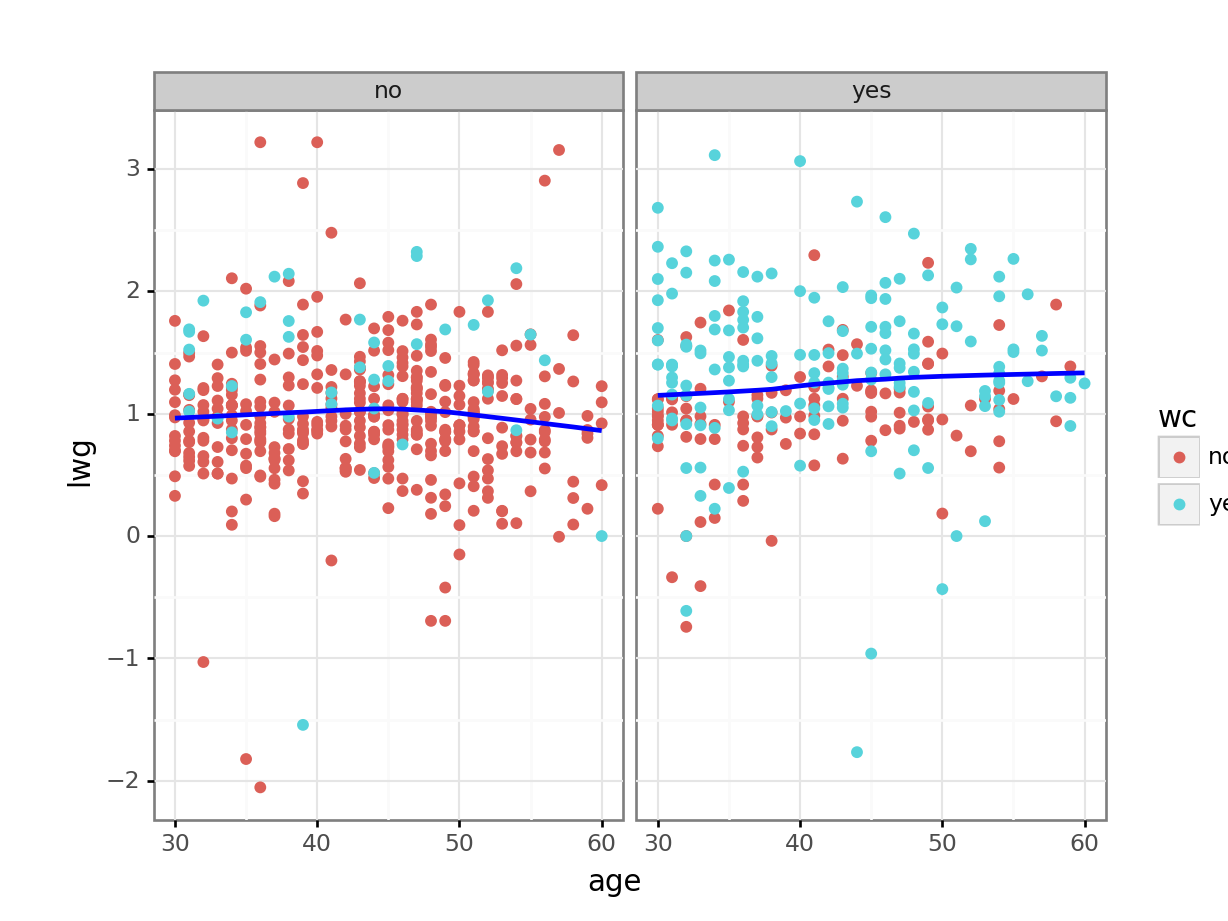
Add a title and provide better axis labels.
print(
    p9.ggplot(mroz, p9.aes(x='age', y='lwg', color='wc')) +
    p9.geom_point() +
    p9.geom_smooth(
        se=False,
        color='blue') +
    p9.facet_wrap('~hc') +
    p9.theme_bw() +
    p9.ggtitle('Womens Wages and Ages') +
    p9.theme(plot_title=p9.element_text(hjust=0.5)) +
    p9.xlab('Log Womens Wages') +
    p9.ylab('Age'))
<ggplot: (-9223371893263836942)>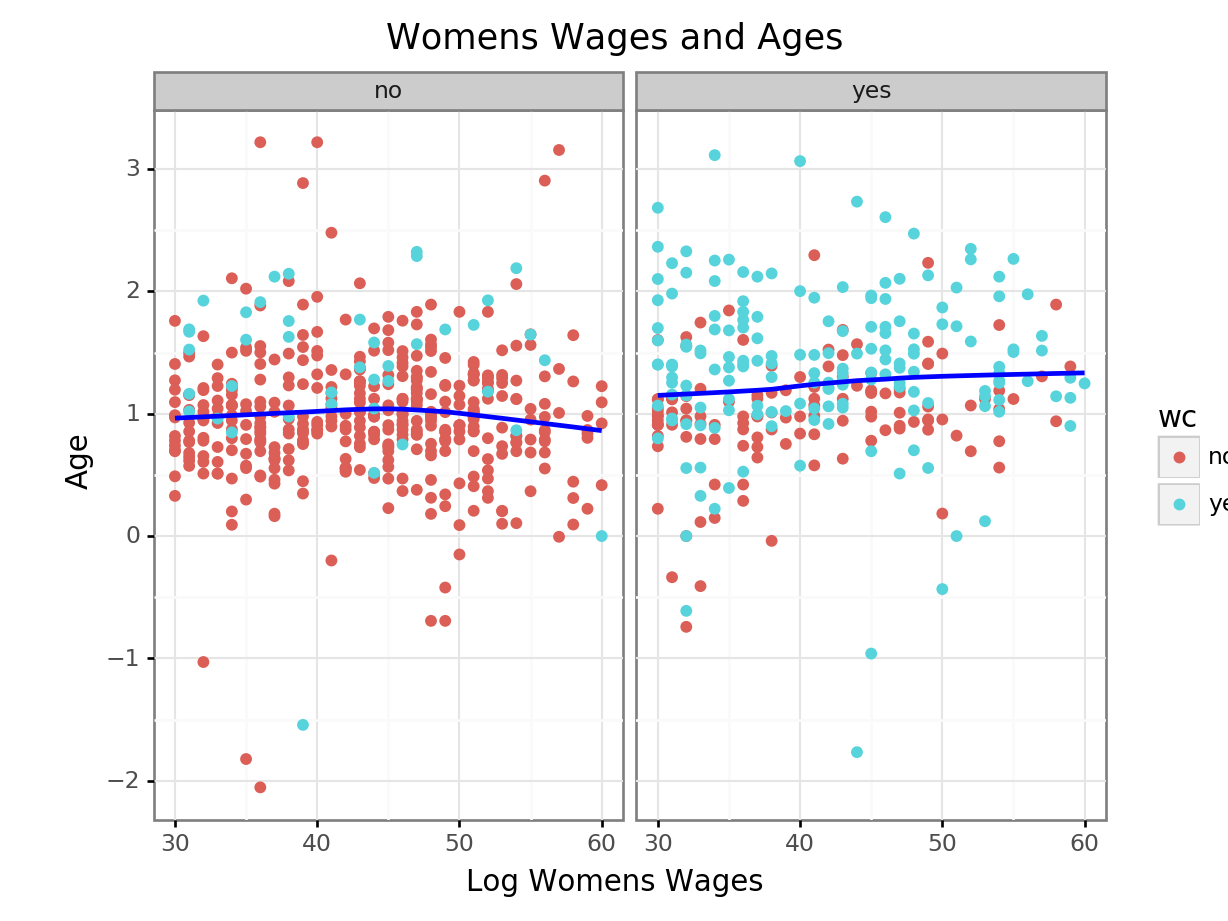
Create a plot that explores the relationship between at least three variables. Use at least one different value than was used in the prior exercise.