- A. The Question (SoA Exam C # 276)
- B. Solution via Hand Calculations
- C. Solution (and Extensions) using R
A. The Question (SoA Exam C # 276)
For a group of policies, you are given:
– (i) Losses follow the distribution function
$$ F(x) = 1 – theta / x, x > 0.$$
– (ii) A sample of 20 losses resulted in the following: $$
{small
begin{matrix}
begin{array}{c|c}
text{Interval} & text{Number of Losses} \ hline
(0, 10] & 9 \
(10, 25] & 6 \
(25, infty) & 5 \ hline
end{array}
end{matrix}
}
$$
Calculate the maximum likelihood estimate of $theta$ .
B. Solution via Hand Calculations
C. Solution (and Extensions) using R
R Solution
##Log Likelihood function
likgrp <- function(theta) {
  loglike <-log(((1-(theta/10))^9)*(((theta/10)-(theta/25))^6)* (((theta/25))^5))
  return(-sum(loglike))
}
#  "optim" is a general purpose minimization function
grplik <- optim(c(1),likgrp,method=c("L-BFGS-B"),hessian=TRUE)
#Estimates - Answer "B" on SoA Problem
grplik$par
## [1] 5.5
That is enough for the SoA problem. Naturally, we can go a bit further.
R Extensions
#standard error
sqrt(diag(solve(grplik$hessian)))
## [1] 1.11243
#t-statistics
(tstat = grplik$par/sqrt(diag(solve(grplik$hessian))) )
## [1] 4.944132
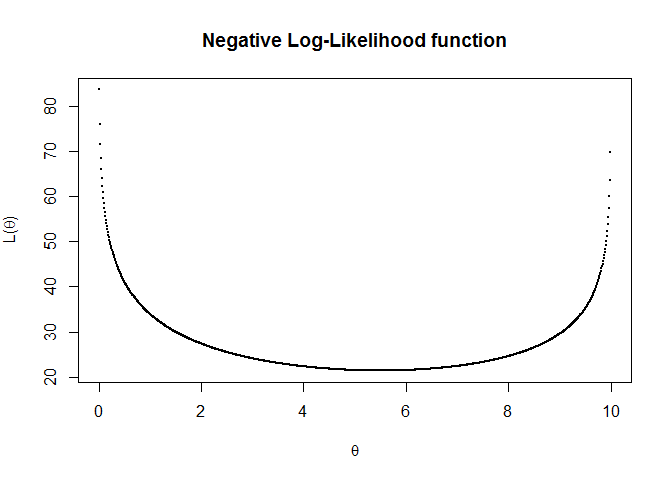
#Plot of Negative Log-Likelihood function
vllh = Vectorize(likgrp,"theta")
theta=seq(0,10, by=0.01)
plot(theta, vllh(theta), pch=16, main ="Negative Log-Likelihood function" , cex=.25,
     xlab=expression(theta), ylab=expression(paste("L(",theta,")")))