Standard Markdown
SVG Graphics
Links to External Files
Embedded Graphics
Begin by drawing a graph. If you are using standard Markdown and creating an HTML file, this will produce a separate PNG graphics file in the same folder as your HTML file.
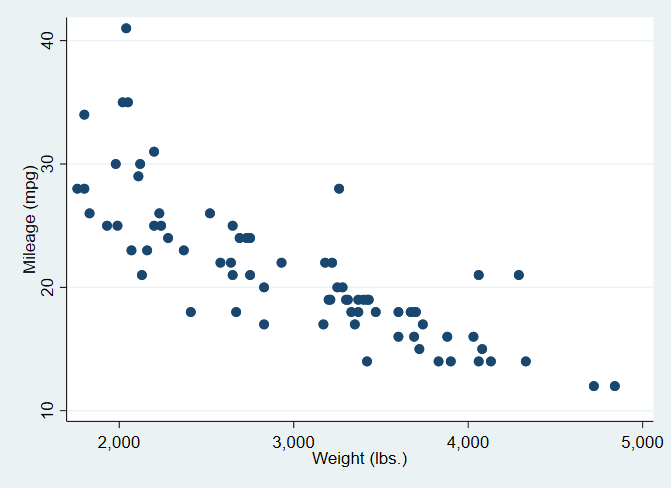
This text in your Markdown
```stata
sysuse auto
scatter mpg weight
```
will produce
. sysuse auto
(1978 Automobile Data)

. scatter mpg weight
Any graphics command that produces output in the default graph window (the graph window named “Graph”) at the end of a dynamic code block will automatically be linked in your HTML document. If you have more than one graphics command within a given code block, or if you used named graphics windows for output, you will have to export the graph and provide a link in your document by including these instructions yourself.
If you move one step beyond standard Markdown, you can use Stata’s dynamic tags to save and link SVG graphics.
To save the current Graph window in SVG format and include a link in your document, you include this text in your document:
<<dd_do: quietly>>
twoway (scatter mpg weight) (lfit mpg weight)
<</dd_do>>
<<dd_graph: svg>>
Note that you do not process the Stata graphics command in a standard dynamic Markdown code block - this would trigger the creation of a PNG file and automatically link it. (If you want to make your Stata code visible to your readers, include it in a non-executable code block.)
twoway (scatter mpg weight) (lfit mpg weight)

While web browsers can display PDF files, they do not include them in ordinary HTML. You can save a graph in PDF format and include a link in your document with this text.
[A PDF link](<<dd_graph: pdf pathonly>>)
An EPS link (for download)
A PS link (for download)
You also have the option of embedding graphics within your HTML file - there are no separate graphics files to keep track of.
You have two methods
The first method looks like this.
<<dd_do: quietly>>
twoway (scatter mpg weight) (qfit mpg weight)
tempfile quad
graph export `quad', as(svg)
<</dd_do>>
<<dd_include: `quad'>>
The second method (Stata 16) would mean processing your source document with a command like this
stmd graphing.stmd, embedimage
Please note that this second method does not work with SVG graphics!