Introduction
Without text, a statistical graph has no meaning. We typically want to provide the reader with guides to interpreting the position and types of graphical objects used - scale and legend annotation. It is also good practice to include titles, captions, and/or notes.
We may also want to add text directly to the plot area.
Almost all the control over the text in a graph lies outside the primary part of the graphics commands. Text generally comes from variable labels, value labels, statistical transformations provided by the graphics routine, or the distribution of data values. Within a graphics command, control over annotation lies mainly in options.
There are scores if not hundreds of options that can be applied to any graph, so it is useful to become familiar with the Stata documentation - you will be using it!
We’ll start with familar data, and add a categorical variable with many categories.
sysuse auto
generate maker = substr(make, 1, strpos(make, " ")-1)
replace maker = make if strpos(make, " ")==0
label variable maker "Manufacturer"
Annotation Outside the Plot Region
Titles, Subtitles, Notes, Captions
scatter mpg weight, title("Gas Mileage") subtitle("Decreases with Weight") ///
    note("1978 data") caption("Figure 1: adding text in the margins")
See help title_options.
There are numerous options here that can be used to style the text itself. These include using extended character sets (including math symbols), specifying font face and size, repositioning text, color, etc..

Axis Titles
Notice the axis labels are just the variable labels. We can relabel our data (help variable label), or we can have arbitrary axis labels (help axis_title_options) that only affect our plot.
scatter mpg weight, xtitle("Weight in pounds") ytitle("Miles per gallon")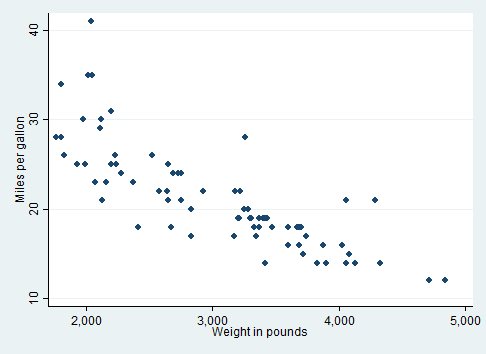
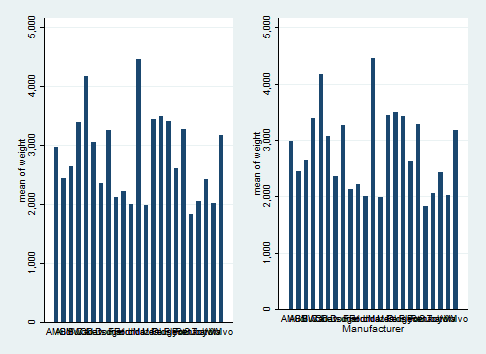
In plots with categorical axes we do not have a categorical title by default, and we are not allowed to use xtitle(), but we can use b1title() instead.
graph bar weight, over(maker) name(g1)
* graph bar weight, over(maker) xtitle("Manufacturer") // error
graph bar weight, over(maker) b1title("Manufacturer") name(g2)