Mixed Models: Diagnostics and Inference solutions
This article contains solutions to exercises for an article in the mixed models series. For a list of topics covered by this series, see the Introduction.
There is often more than one approach to the exercises. Do not be concerned if your approach is different than the solution provided.
We will load some packages which will be used in the solutions.
library(ggplot2)
Exercise solutions
Use the models from sleepstudy data set for the following exercises. The models used in these solutions were constructed in the the Solutions for the Model's article.
Create a residual plot for your linear sleep study model.
plot(ssc)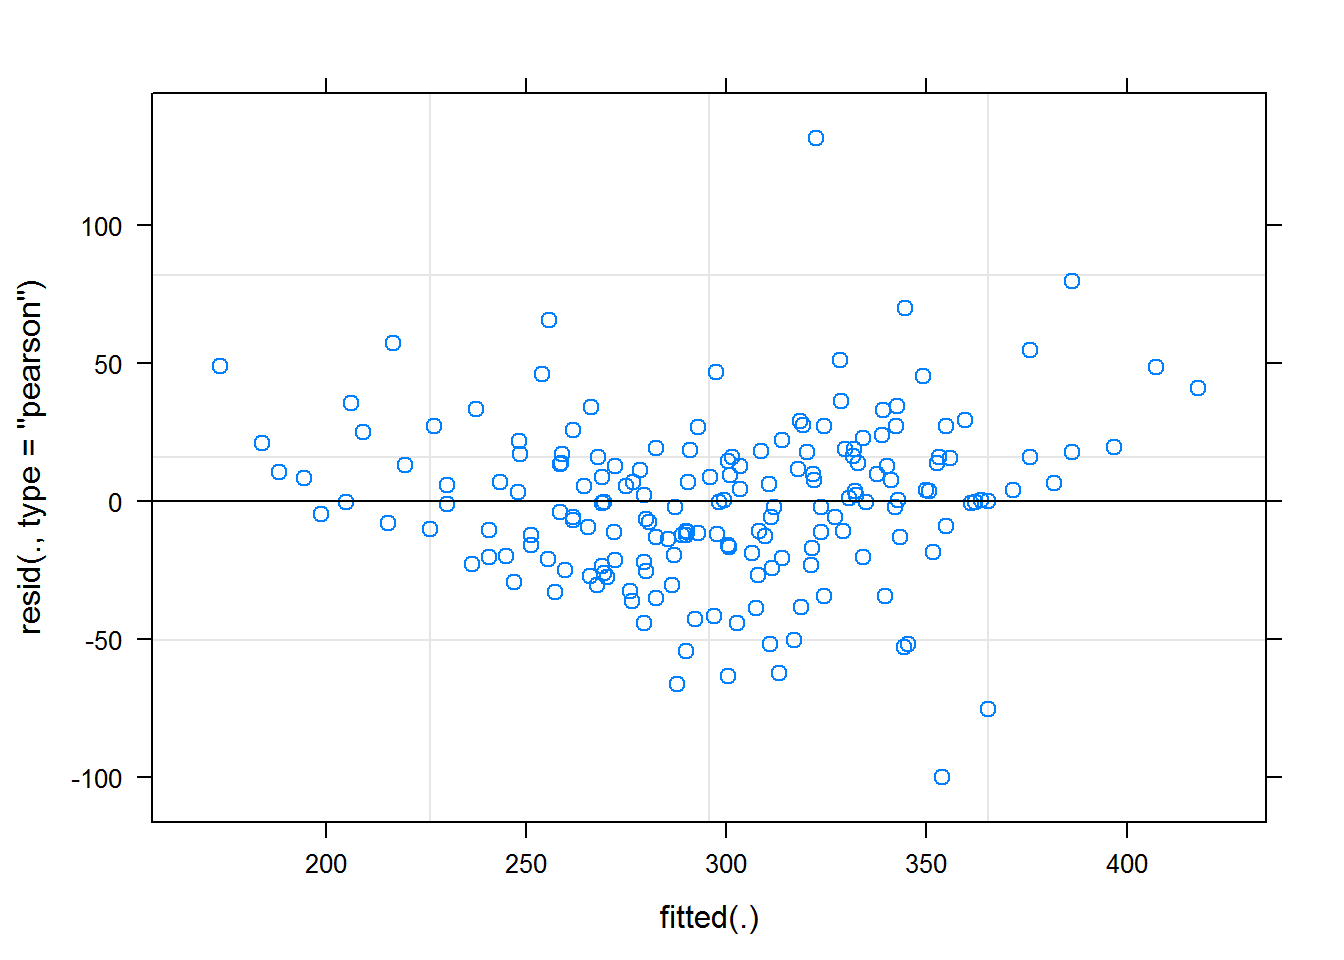
Check the normality of the residuals from your linear sleep study model.
qqnorm(residuals(ssc))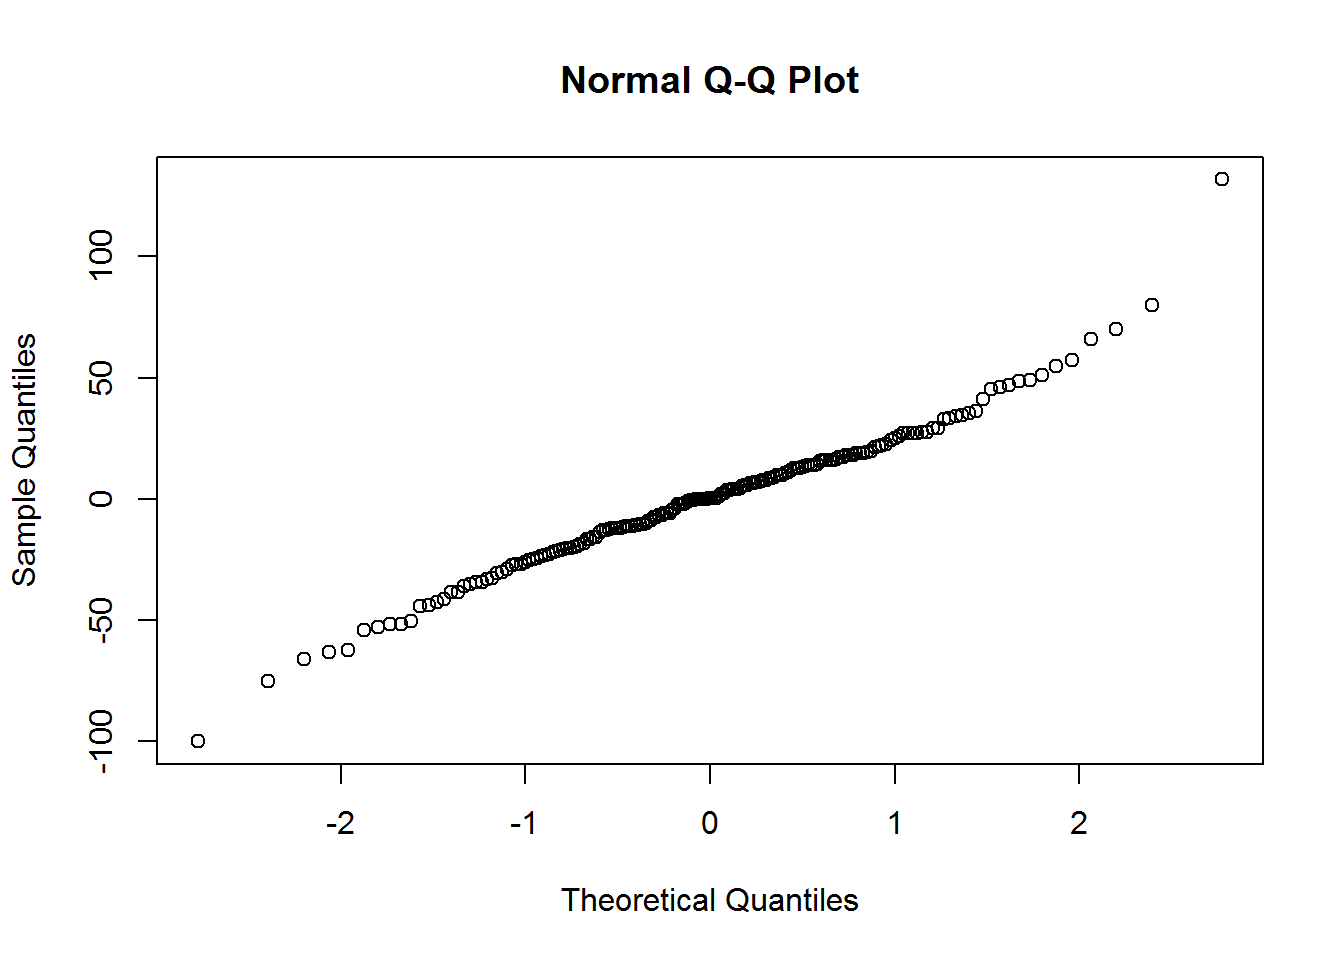
Check if your linear sleep study model has any leverage points are of concern.
ggplot(data.frame(lev=hatvalues(ssc),pearson=residuals(ssc,type="pearson")),
    aes(x=lev,y=pearson)) +
  geom_point() +
  theme_bw()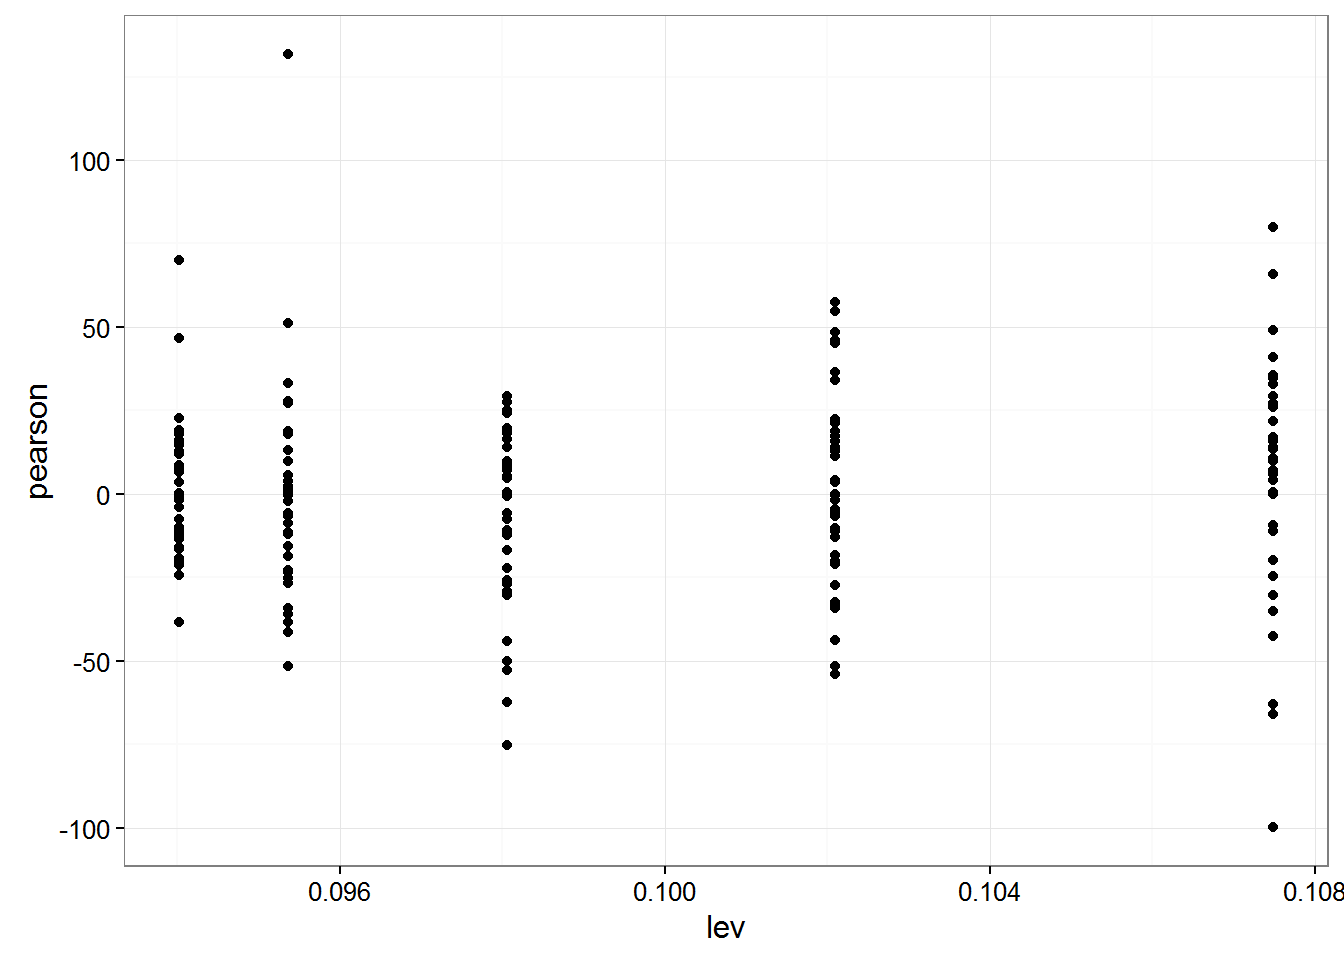
Predict the average response time for eight days in the sleep deprivation study.
newDatSS <- data.frame(Days=c(8))
predict(ssc,newDatSS,re.form=NA,type="response")
1 335.1434
Return to the Diagnostics and Other Inferences article
Last Revised: 3/30/2016