SAS introduced the Output Delivery System (ODS) in version 7 which provides a way of redirecting and customizing tabular SAS output. SAS has extended the capabilities of ODS in version 9.1 to include graphics for some of its statistical procedures. Using ODS graphics, a procedure automatically creates the graphs that are most commonly needed for a particular analysis and eliminates the need to save numerical results in an output data set, manipulate them with a DATA step program, and display them with a graphics procedure.
This document illustrates how you can use ODS to:
- create statistical graphics in various formats including Rich Text Format (RTF), PostScript (PS), or HTML (HTM) formatted files for inclusion in other programs like Word, WordPerfect, Latex, or Internet Explorer.
- select and exclude components of the statistical graphics output
- use styles and templates to customize the appearance of statistical graphics.
ODS for tabular output is documented in Redirecting and Customizing Tabular Output in SAS.
Procedures Supporting ODS Graphics
ODS for statistical graphics is still under development and considered "experimental." So far, the following procedures support ODS graphics in SAS 9.1:
Base SAS: CORR
SAS/ETS: ARIMA, AUTOREG, ENTROPY, EXPAND, MODEL,
SYSLIN, TIMESERIES, UCM,
VARMAX, X12
SAS/STAT: ANOVA, CORRESP, GAM, GENMOD, GLM, KDE, LIFETEST, LOESS, LOGISTIC, MI, MIXED, PHREG, PRINCOMP, PRINQUAL, REG, ROBUSTREG
To get an idea of what the graphics produced from these procedures look like, visit SAS's web site.
Creating Graphics Files
The example below illustrates just how simple it is to generate graphics. The following statements invoke the REG procedure and fit a simple linear regression model.
ods html;
ods graphics on;
proc reg data=Class;
   model Weight = Height;
quit;
ods graphics off;
ods html close;
The ODS HTML statement specifies an HTML destination for the output. The ODS GRAPHICS statement is specified to request ODS Graphics in addition to the usual ODS tabular output. The ODS GRAPHICS OFF statement disables the ODS Graphics, and ODS HTML CLOSE statement closes the HTML destination.
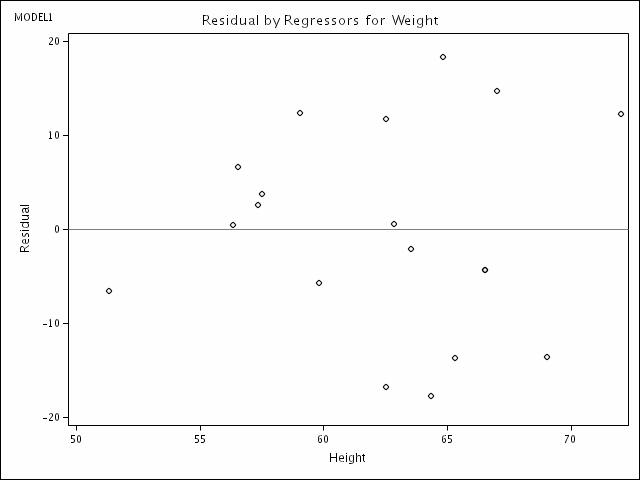
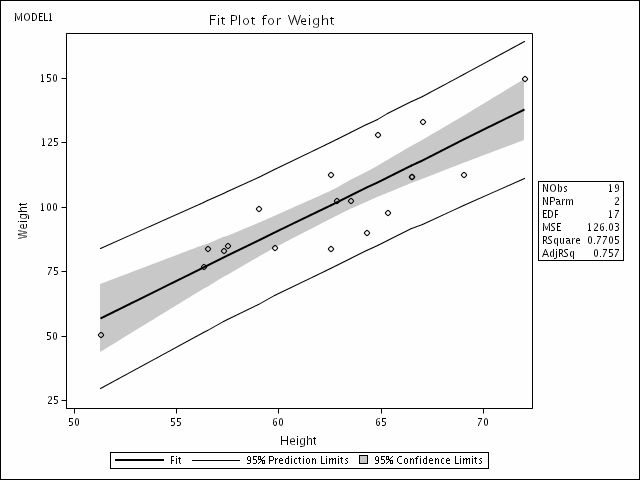
In the case of the REG procedure, the graphical output produced by ODS consists of a fit diagnostics panel, a residual plot, and a fit plot. These are shown below.
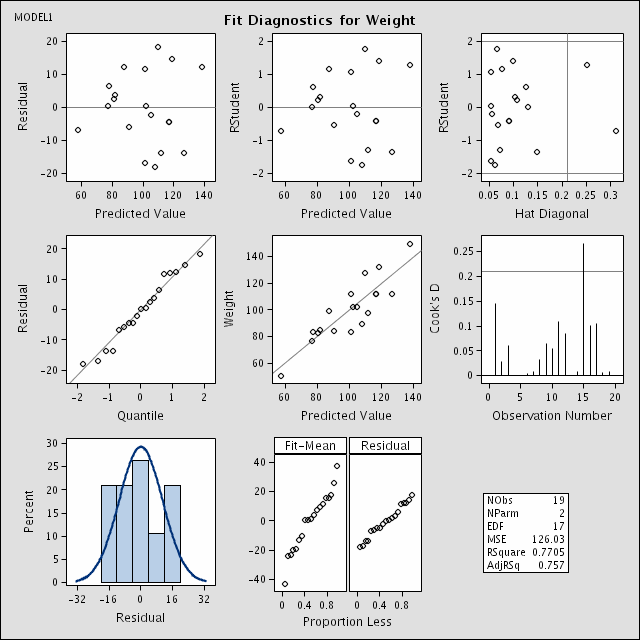
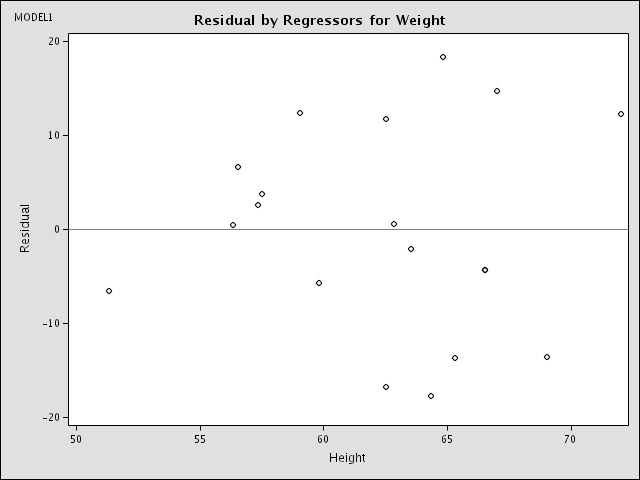
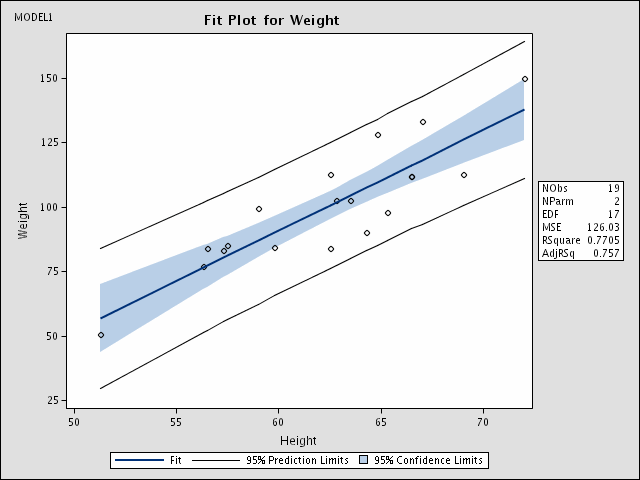
Note that these graphics are not displayed when you run your SAS job. Rather, the files containing the plots are written to disk in the directory from which you invoked SAS. For this example, SAS wrote the three plots to GIF files - DiagnosticsPanel0.gif, Fit2.gif, and ResidualPanel11.gif. SAS also wrote an HTML file called sashtml.sas for displaying both the tabular output and graphics on a single web page. SAS names these files in such a way to make them recognizable. Of course, using SAS options, you can change where SAS writes these files. See Chapter 15 of the SAS/Stat Online User's Guide for details.
These plots can easily be inserted in Word or WordPerfect documents.
Technical note: If you have written your graphic files to a directory on Linux like your PUBLIC_web directory that you want others to be able to view from a browser, check the file permissions to make sure they are world-readable. Including the SAS command
x "umask 022";
at the beginning of your SAS program will ensure that files written for the duration of the SAS job are world-readable.
Using ODS Graphics with Procedure Options
Some SAS procedures, including REG, have their own options for generating graphics. If you specify ODS GRAPHICS ON and specify any of procedure options for graphs, ODS will automatically write these graphs to files. For example, if the SAS statement
plot r.*p.;
were included in the REG code above, a fourth GIF file containing a plot of residual vs. predicted values would be written to disk automatically.
Selecting and Excluding Graphs
You can also control which graphs you want generated. This feature is documented in Redirecting and Customizing Tabular Output in SAS.
Specifying File Formats
Whenever you use ODS Graphics, you must specify a destination file format. In the above example, HTML was specified and SAS created HTML and GIF formatted files. Other file types supported include LATEX, PDF, PS, PCL, and RTF. For example, if you wanted files formatted for PDF for use with Adobe Acrobat, you would specify:
ods pdf;
If you are using HTML or LATEX as the destination, your graphs are individually produced in a specific image file type, such as GIF or PostScript. If you are using PDF, PS, PCL, or RTF as the destination, the graphs (and tables) are all written to one file. In the case of RTF, this file can easily be opened in Word or WordPerfect. You could then copy and paste individual graphs into a PowerPoint presentation for example. In general, RTF output is convenient for exchange of graphical results between Windows applications through the clipboard. However, since GIF files can be directly inserted in Office applications, it may be more convenient just to use the HTML destination.
Customizing The Appearance of Your SAS Output
With ODS you can change the appearance of most of your SAS output. To change the overall look of your output, use ODS styles. To further customize the appearance and table of your output, you can change the templates SAS uses to generate output or even create your own templates. A brief overview of templates is provided in Redirecting and Customizing Tabular Output in SAS. For more detailed information, please refer to SAS's on-line manual.
ODS Styles
ODS styles control the overall look of your output. A style definition provides formatting information for specific visual aspects of your SAS output. For ODS graphics, this includes the appearance of line and marker properties in addition to font and color information.
You can specify a style using the style option in the ODS destination statement. Each style produces output with the same table, but with a somewhat different visual appearance. Of the SAS-supplied styles, SAS recommends four for use with ODS Graphics: ANALYSIS, DEFAULT, JOURNAL, and STATISTICAL. In the example below, the JOURNAL style is specified:
ods latex style=journal;
ods graphics on;
proc reg data=Class;
   model Weight = Height;
quit;
ods graphics off;
ods latex close;
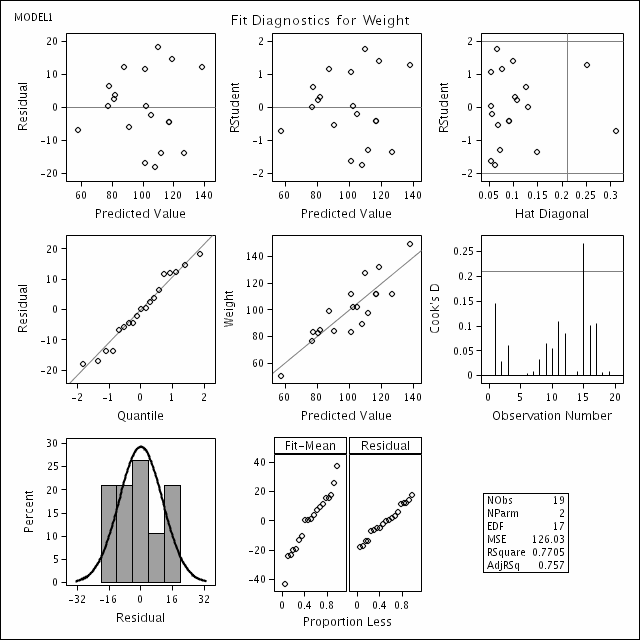
The output below illustrates our favorite style - journal:
Once you start using ODS you will quickly find that you need information not contained in this overview document. SAS's comprehensive user guide to ODS can be found online at http://support.sas.com/documentation/onlinedoc/91pdf/sasdoc_91/base_ods_7032.pdf.
Last Revised: 2/1/2006