Understanding the Wisconsin Economy
Noah Williams, UW-Madison, nmwilliams@wisc.edu
Update: A Response to Comments
by Marc Levine
Recently there have been several stories in
the press (http://huff.to/1DHE1OF, http://bit.ly/1aYoGSS, http://bit.ly/1OOKHRp ) that
provide a misleading picture of the economy in the state of
Wisconsin. These
stories base their economic analysis on the rankings by state
of job growth and wage growth from Quarterly Census of
Employment and Wages provided by the Bureau of Labor
Statistics. (A
press link to the data is here: http://bit.ly/1OkQ5Ro.) The
most recent statewide rankings show that Wisconsin has slipped
into the 40th place in job growth and 42nd
in wage growth. While
these figures are accurate, they provide a very limited and
misleading outlook on the statewide labor market and broader
economy. In
particular, a look at broader data shows that the economy in
Wisconsin is much healthier than these indicators suggest, and
has outperformed the overall national economy in many ways.
Employment
·
Looking
at broader labor market data shows that Wisconsin has
significantly outperformed higher ranked states like Michigan,
and has outpaced the national average along many dimensions.
The job growth indicator does not provide
an accurate overall impression of the labor market and
employment dynamics in each state. For example, economies
which were hardest hit by the recession of 2007 would need to
have higher job growth simply to return to the same place. To
be sure, the economy in North Dakota, which has been
consistently at the top of the rankings for the past several
years, is booming, with employment growth driven largely by
the energy boom. But the rankings also show that Wisconsin has
been ranked between 31st and 41st over
the past three years, while Michigan has been regularly in the
top ten until slipping a bit recently. However looking at
broader labor market data shows that Wisconsin has
significantly outperformed Michigan, and has outpaced the
national average along many dimensions.
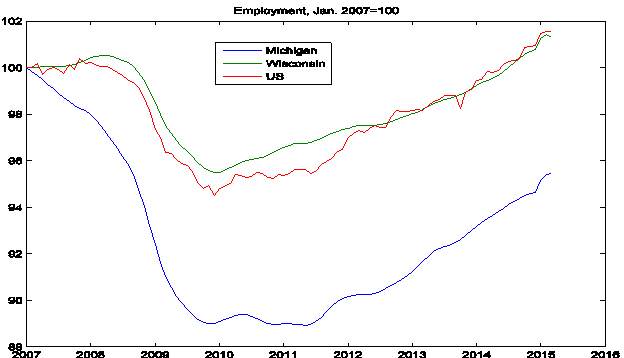
The figure above shows the employment data,
drawn from the BLS Household Survey, which provides the more
commonly used data underpinning the unemployment rate. The figure shows
employment for Michigan, Wisconsin, and the US as a whole,
with January 2007 indexed to 100. The figure makes clear
that employment growth in Michigan has indeed been relatively
rapid since the middle of 2011.
But this was largely due to the fact that employment
had collapsed so dramatically in the recession from 2007-2009,
and so employment remains 4% below its 2007 level. By
contrast, Wisconsin tracks the national average rather
closely. The
recession was somewhat milder in Wisconsin than in the nation
as a whole, and so job growth after the recession was somewhat
slower. But over the past three years job growth in Wisconsin
tracks the national average rather closely. Thus although job
growth in Wisconsin has not matched some of the fastest
growing states, it has been at least as strong as the national
average.
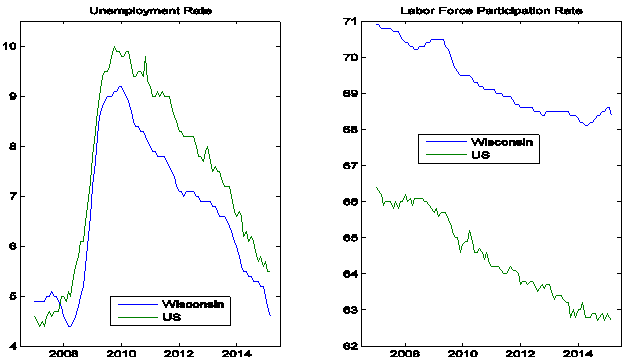
Some other indicators highlight other
aspects of the labor market where Wisconsin has outperformed
the national average. The
figure above shows the unemployment rate and the labor force
participation rate for Wisconsin and the US as a whole. The unemployment rate
in Wisconsin did not spike as dramatically as in the rest of
the nation during the recession, but even from the lower peak
it has fallen rapidly, especially over the past couple of
years. Since the beginning of 2014 the unemployment rate has
fallen by 1.5 percentage points, and now stands at 4.6% in
comparison to the 5.5% national average.
In addition, a significant component of the
reduction in the unemployment rate nationwide has been a
decline in the labor force participation rate. Some of the decline
in participation has been due to longer run demographic
factors, driven by the aging of the population. However a
significant component has been a cyclical, with unemployed
workers stopping searching for a job. The labor force
participation rate in Wisconsin has historically been above
the national average, and it has declined since 2007, but it
has increased over the past year and has been roughly stable
since the beginning of 2012. By comparison, if the labor force
participation rate in the US as a whole had remained constant
since January 2012 (rather than falling by one percentage
point), the national unemployment rate would now be 7.0%
rather than 5.5%. Thus the national unemployment rate hides
some additional weaknesses in the labor market which are not
present in Wisconsin, as participation in the state has
remained strong and even increased as the unemployment rate
has fallen.
Wages,
Earnings, and Income
·
Average
earnings growth in Wisconsin has matched higher ranked states
like South Dakota, and has been faster than the national
average. In addition, broader measures of household income
have increased recently in Wisconsin while falling nationally.
Beyond employment, earnings of workers and
incomes of households are important aspects of the economy. We
are not just interested in whether workers are employed but
whether households are improving economically. Along those
lines, the other labor market indicator which has been cited
recently has been the state rankings on wage growth. Overall, the data
there has been more mixed, with Wisconsin ranking in the 20s
or better for most of the period from 2011-2013, before
slipping to the 30s in 2014 and down to 42nd in the
most recent survey. North Dakota is again at the top of the
table for most of the sample period, and in addition South
Dakota is ranked in the top 10 for most of the period,
frequently in the top 5. Again, while this ranking sheds some
light on the earnings and incomes of workers in each state, it
provides an incomplete and perhaps misleading picture.
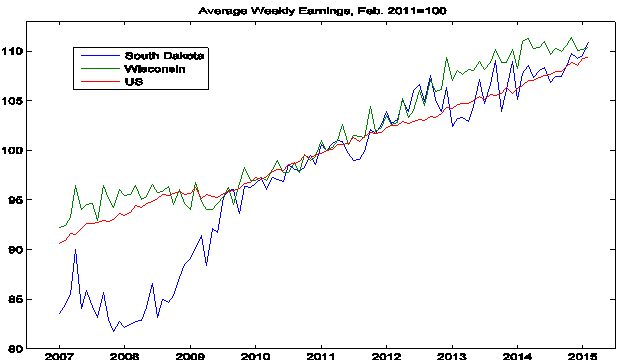
The figure above shows data from a
different source, monthly data from 2007-2014 on average
weekly earnings provided by the BLS. To make this data
comparable to the wage growth data in the Quarterly Census, I
have indexed February 2011 to 100, and I plot the data for
South Dakota, Wisconsin, and the US as a whole. Although the
data are noisy, the figure shows that rather than stagnating
or being outpaced by states like South Dakota, average
earnings growth in Wisconsin has matched South Dakota, and has
been faster than the national average. In particular, over
that span average earnings have grown by over 10% in
Wisconsin, more than one percentage point faster than the
national average.
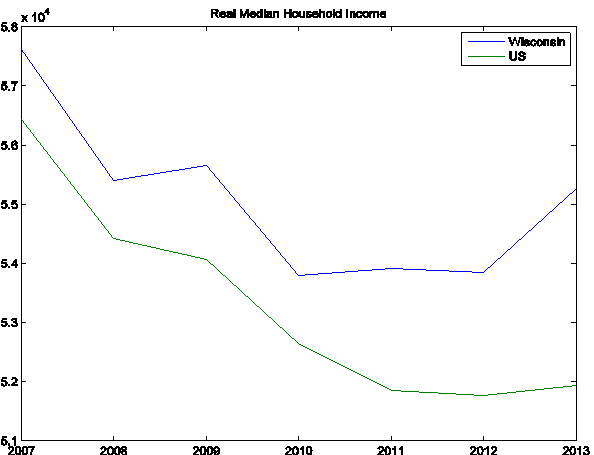
In addition, Wisconsin has done even better
when looking at broader measures of household income. The figure above shows
real median household income, provided by the Census Bureau on
an annual basis from 2007-2013 (the last date for which data
are available), in the United States and Wisconsin. Despite having only
a few data points, this provides a broader measure income for
a typical household, going beyond the labor market earnings
which were discussed above, and so arguably provides a better
indicator of household welfare.
Median incomes in Wisconsin have been above the
national average throughout the sample, and both have declined
from the pre-recession peak in 2007. But median incomes in
Wisconsin stabilized in 2011-2012 and grew significantly in
2013, while they continued to fall nationally in 2011 and
remained low thereafter. From the end of 2010, real median
household income in Wisconsin has grown by 2.7% while it has
fallen by 1.3% nationwide.
Summary
Overall, the economy of Wisconsin has
performed quite well since the end of the recession, and in
particular since the start of Governor Walker’s first term in
2011. To be sure, problems still remain and overall growth and
growth in employment have not yet reached their potential or
been as rapid as one might hope. Policies and other factors at
the national level impact the states and should not be immune
from sharing the blame. But the overall state of the economy
in Wisconsin is strong and improving.