Stata can easily produce "publication quality" graphics, but it takes a few more steps to actually put them in a publication. This article will discuss how to save Stata graphs in various formats. It will also show you step-by-step how to insert a Stata graph into a Word document or PDF file.
Saving a Graph
When you create a graph in Stata, the result is simply a picture on the screen. If you want to be able to view it after your current program finishes, you'll need to save it.
graph save
The graph save command tells Stata to save your current graph (the most recently created) in Stata's gph format. The syntax is simply
graph save filename, replace
where filename should be replaced by the name you want Stata to give your file. Stata will add .gph to the end of the filename automatically. The replace option tells Stata to overwrite the current version of that graph if one exists--without that your do file will fail if you try to run it more than once.
The disadvantage of graph save is that the .gph files it produces can only be read by Stata. To create files usable by other programs you'll need graph export. However, graph save can be useful if you want to move graphs between computers--for example from a Linux server to a PC.
graph use
The graph use command opens a .gph file previously saved on disk. The graph will be displayed, and it also becomes the current graph that subsequent commands will act on. The syntax is
graph use filename
The filename will be assumed to end in .gph if you don't include an extension.
graph export
The graph export command saves your current graph in the format you choose. The syntax is
graph export filename.extension, replace
Again, filename should be replaced by the name you want. The extension you choose will determine the file format. What formats are available depends on how you're running Stata:
| Extension | File Format | Where Available | ||
|---|---|---|---|---|
| Windows | Linux (Interactive) | Linux (Batch Mode) | ||
| .ps | PostScript | Yes | Yes | Yes |
| .eps | Encapsulated Postscript | Yes | Yes | Yes |
| .tif | Tagged Image Format | Yes | Yes | No |
| .png | Portable Network Graphic | Yes | Yes | Yes |
| .wmf | Windows Metafile | Yes | No | No |
| .emf | Windows Enhanced Metafile | Yes | No | No |
| Portable Document Format | Yes | Yes | Yes | |
Making graphs can take a long time, and if you have a lot of graphs to make you might want to use Stata MP on Linstat—but you can't export to emf format (usually the best for use in Microsoft Word documents) on Linstat. This is where graph save comes in: create your graphs using Linstat, and save them using graph save. Then you can open the resulting .gph files in Windows Stata with graph use, and finally use graph export to convert them to emf.
Inserting a Graph into a Word Document
We've found that for best results in Word you generally want to use emf (Enhanced Metafile) format. So first create your graph, then save it in emf format using graph export:
graph export graph.emf, replace
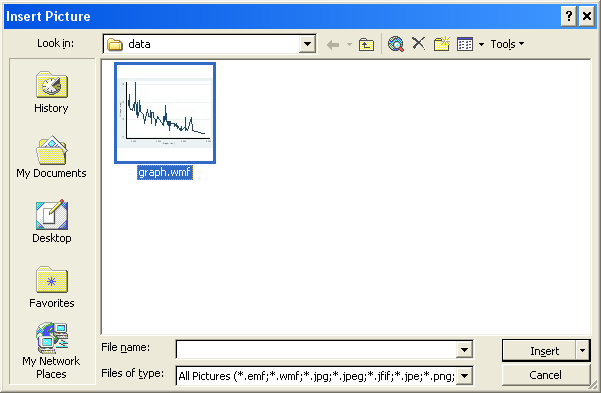
Next open the document into which you want to insert the graph using Word. Put the cursor at the desired location. Then click Insert, Picture, From File. Locate the directory where you saved the graph, select it, and click Insert.
Inserting a Graph into a PDF file
If you want to put your graph in a PDF file, PostScript works well. Create your graph, then save it in ps format using graph export:
graph export graph.ps, replace
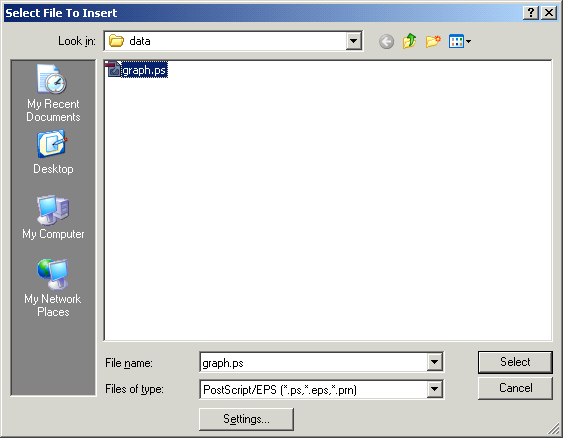
Next open Adobe Acrobat (not Adobe Reader, which only reads PDF files--Adobe Acrobat is available on Winstat). If you already have a PDF file and you want to add the graph to it, open the file, then click Document, Insert Pages. Set Files of Type to PostScript/EPS. Locate the proper directory, click on your graph, and click Select.
Using Graphs Elsewhere
What format will work in other situations is difficult to predict, and you may need to try several alternatives.
PDF is a standard format for printing across all different kinds of computers. This makes it a good choice for use on computers other than PCs.
Enhanced Metafile is an excellent choice if you want to use the graph in a Windows program, as tools for working with emf files are embedded in Windows. However, computers that are not running Windows will probably have no way to open emf files at all.
PNG is a great choice for web pages. It's also a good format for just sending a graph to someone—most computers will open it with some sort of picture viewer or editor.
Last Revised: 3/24/2021